We’ve added Heatmap Galleries to Smartlook Mobile Analytics.
Here are some of the key changes we’ve made to Mobile heatmaps:
- Heatmaps now have a separate tab on the dashboard
- You can now create galleries for all of the fragments in your application
- Galleries are created automatically using customizable date intervals
This means that you don’t have to create heatmaps for individual pages.
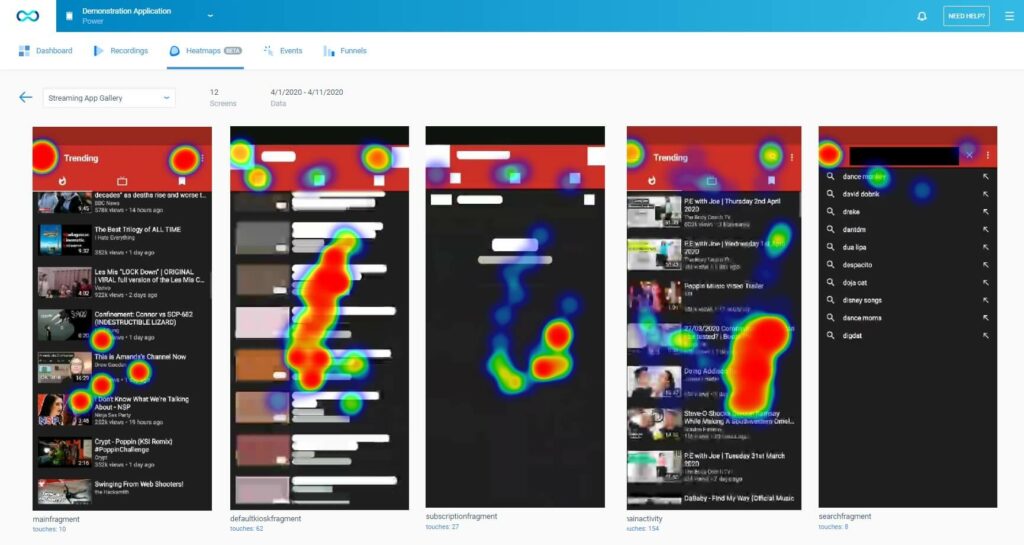
In fact, you only need to create a Gallery. Galleries display all of the different fragments of your application all in one location. This will save you time finding the correct heatmap. We’ve removed the necessity of finding the fragments, identifying their names, and then renaming and saving it.
Instead, we’ve simplified the process by creating a two-step solution.
- Create a gallery
- Choose the date range
Then a gallery of all the heatmaps for the date range will be displayed and viewable in one location. This setup will be in Smartlook Beta for some time while we listen to your feedback and make changes to benefit Smarlook customers.
We want to help your developers.
That’s why we’ve taken the manual “setup work” out of the equation. Now, automation is the direction Smartlook is taking. And as you can see below, the galleries simplify how heatmaps work and make them much more accessible.

And make heatmaps accessible to all users at the click of a button.
Analysts, support teams, sales teams, marketing specialists, and company owners can easily take a look at a Smartlook heatmap gallery to see every aspect of the application.
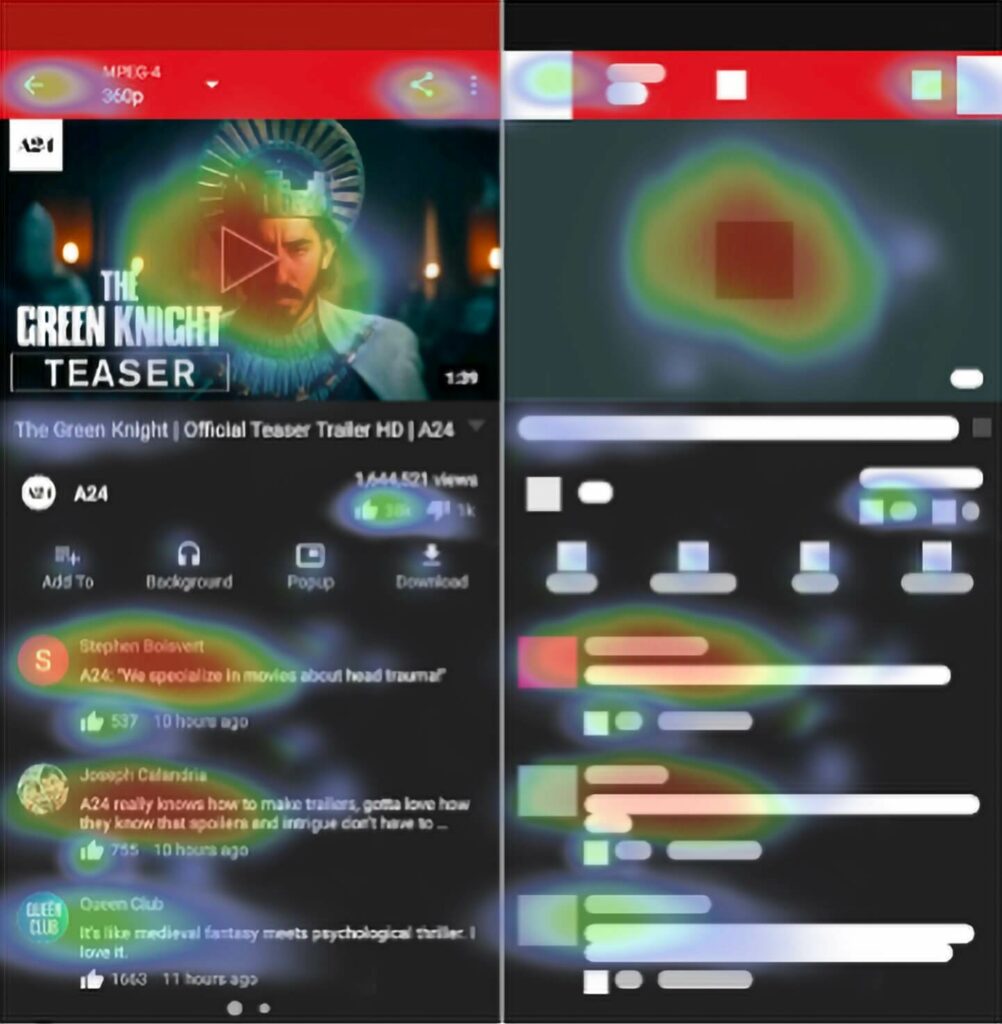
Mobile heatmap galleries are for all users to gain immediate insights… It’s all there at your fingertips.
Forgot to set up a heatmap? No worries – Smartlook creates retroactive Galleries.
As with all heatmaps in Smartlook, the data comes from the session recordings. Therefore, creating a heatmap gallery now with old data is always a possibility. Simply create a heatmap gallery with a custom date range. When in doubt, you can always increase your recording history by adjusting your package. This provides security for data analysts and convenience for marketing teams who want to track campaign impact.
How to create a heatmap gallery:
- On your mobile project heatmaps tab, simply click “Create heatmap gallery”

2. Then simply give the new gallery a name and choose a date range to fetch the data

After clicking “Create heatmap gallery”, you’ll have all the heatmaps ready and available to you.
Upgrades:
The heatmap galleries come as the second upgrade to mobile application recording in 2020. Earlier in the year, we released the option to configure recordings modes for the privacy of your users, and the simplicity of developers.

We’re very excited to release this helpful addition to Smartlook. Heatmap galleries for Mobiles will save your team time and provide quick answers to questions you have about your application.
Our goals are accuracy, accessibility, and simplicity. As always, we’re looking forward to hearing your feedback to make Smartlook even better.
Have any suggestions? Just get in touch with support@smartlook.com
New to Smarlook? Create a free account


