Product analytics tools track user interactions to help product and marketing teams better understand user behavior, find errors, and make more informed decisions about product changes.
All product analytics tools collect user interactions, typically called “events,” and give you a variety of ways to analyze them to learn about user behavior. But they take a few different approaches to gathering the data. Some tools require you to define what you want to collect ahead of time, and others collect everything and let you decide what to analyze after the fact.
Additionally, some tools also pair this user interaction data with session replay to help you understand why the trends you observe in the event data are happening — a very powerful combination.
Our tool, Smartlook, automatically captures every user interaction and combines that data with session replay, which saves time and gives you immediate insights that you just can’t get with tools that only track event data.
In this article, we’ll clearly explain the differences between 3 types of product analytics tools and how those differences impact the kind of insights you can get from each one. We’ll also share where Smartlook fits into the mix, and explain why we believe it’s an essential product analytics tool for every team.
This article will look at the following:
- Understanding the differences between top product analytics platforms
- Product analytics software tools that combine event-based analytics with session recordings
- Behavioral analytics tools that only offer event-based analytics
- User engagement tools that also offer event-based analytics
Smartlook combines the power of event tracking, session recording, funnel analysis, and heatmaps in one tool to help you improve conversion rates, find and fix bugs faster, and boost customer retention. Create a free account and start understanding your users today.
Understanding the differences between the best product analytics tools
The differences between the tools show up in 3 primary ways:
- How the data is collected
Product analytics tools typically take 1 of 2 approaches to collecting data: auto-capture or manual instrumentation. With auto-capture, the software collects every user interaction with a single snippet installed in your product. With manual instrumentation, you have to manually set up data collection (e.g. define an event) for each kind of interaction you want to track and then wait for data to collect on that event or interaction.
The advantage of auto-tracking, besides taking less time, is that you have the ability to retroactively define events later on if you realize you want to track something new. You’ll immediately be able to analyze that event based on historical user sessions, instead of waiting for a software engineer to set up tracking for the event and then waiting for the data to roll in.
- What it tracks
While almost all the tools claim to track every user interaction, there are major differences in how detailed of an analysis you can do on those interactions. The options range from surface-level analysis (how many users clicked a particular button) to incredibly in-depth comparison options that require a data science background to comprehend. The features available will impact the kinds of questions you can ask about your users’ behavior and the overall value of insights you can draw out from the data, as well as the learning curve when you first start using the tool.
- Support for native mobile apps
The tools differ on whether they support native mobile applications (at all) and which mobile development frameworks they support. For team building products with both a desktop and native mobile version, it’s imperative to have one tool that can handle both.
As we go through the different categories of tools, we’ll call out how they collect data, what types of events they track, and whether they can support native mobile apps.
Product analytics software tools that combine event-based analytics with session recordings
The 3 product analytics software tools in this list offer both event-based analytics and session recordings. They automatically collect all user interactions with your website and give you the ability to either watch individual user sessions to understand specific user behaviors, or analyze event metrics in aggregate to understand how your website is performing and find correlations between events.
No matter what tool you use to collect and analyze events, you could benefit from using a session recording tool to observe users navigating through your site. If you don’t have a way of gathering that qualitative feedback, you’ll often be left wondering why you’re seeing the trends in the event data, with no real way to find out.
Many product teams start with one of the tools from this category, and if they need to dig deeper into the user interaction data, they add a tool from the next category.
Smartlook: Get qualitative and quantitative analysis in the same tool with event-based analytics and always-on session recordings
Start collecting every user interaction with one snippet
Once you add Smartlook’s snippet to your website or mobile app, it starts collecting every user interaction from every user session.
Unlike other event-based analytics tools, you don’t need to submit an extensive list of events you want to track to your engineering team before you can start collecting data.
And, as we mentioned before, auto-collecting everything gives you the ability to retroactively analyze historical data.
This allows our customers to get answers to their questions weeks or even months faster than they would with other tools. For one of our mobile game development customers, this makes Smartlook indispensable because they often don’t know what kind of events they’re going to want to track until they see them in a session replay. Being able to immediately analyze the data as soon as they define an event saves them from having a delay of several weeks between detecting an anomaly and being able to investigate it.
Analyze dozens of types of user interactions without coding, or define custom events for special cases
Smartlook offers 3 no-code options for defining events. You can choose from a list, use the no-code event picker, or create an event from a recording. The standard events available include:
- Clicked on URL
- Clicked on text
- Typed text
- Clicked on a CSS selector (allowing you to select any element in the page)
You can also create custom events tied to any element that can be located and defined uniquely in the DOM (but a programmer will be required). For mobile apps, all but a few of the most basic events must be defined with custom events.
For example, our customer, StoragePug, a real estate marketing software platform for self-storage businesses, used Smartlook’s API to set up a series of custom events including:
- Portal log-ins
- Location page visits
- Log-ins to the Lead Manager
- Log-ins to the Unit Manager
- Button clicks
For each event you define, you can see the total number of times that event has happened within a particular time period, as well as the number of unique visitors who performed that event. This makes it easy for you to track key performance indicators (KPIs) around business-critical actions in your product.
You can also compare multiple events to each other to see trends and correlations, as you can see in the screenshot below of Smartlook’s events manager.
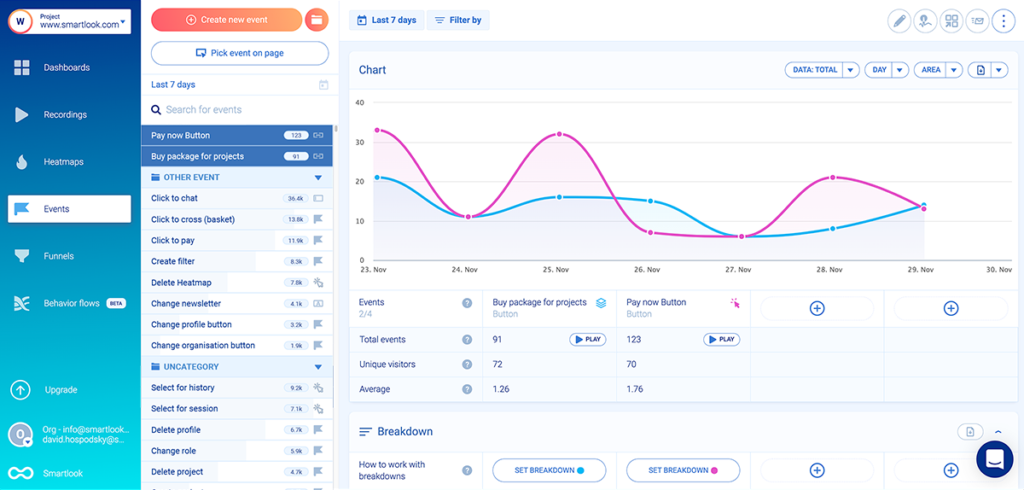
And for each event, you can see a breakdown by the location of the user, the device or operating system of the user, and a variety of custom event properties, which could be things like registered or unregistered users, type of subscription, or product availability. For example, in the screenshot below, you can see a breakdown of the event “Blog visit” by device type.

You can save any combination of events and properties as a user segment (e.g., first-time visitors who click “add to cart”). The segment will appear in your dashboard, letting you monitor your product’s performance in real-time.
And since Smartlook also offers session replay, you can always click on the “Play” button next to any event segment to watch only those recordings.
To see how easy it is to work with events in Smartlook, you can create a free account in our live public demo and click on the events manager (the flag icon) in the left-hand sidebar. No username, email address, or credit card required.
There are many use cases for the combination of session replay with event metrics.
For example, let’s say you’re a product manager of a SaaS app, and you want to track user adoption of a new feature. Using the no-code event picker, you could quickly define the new feature as an event in Smartlook and immediately see how many users interacted with it, what devices they were using, which cities or countries it was most popular in, and compare those metrics to another existing feature.
But let’s say that adoption of the feature is high for iOS users, but low for Android. That’s a notable insight, but it’s hard to act on or “fix” that issue without knowing more about why adoption of that feature is lower on Android. But with Smartlook, you can click the “Play” button to watch recordings of Android users and compare them to recordings of iOS users. Perhaps the keyboard is popping up unexpectedly and obscuring the feature on Android. Whatever the case, there’s simply no substitute for watching recordings of how real users interact with a feature.
This sort of analysis is only possible with a tool that includes both event tracking and session recording. The event stats can tell you there’s a problem (low adoption on Android), and the session recordings let you investigate why that problem exists (the keyboard blocking the feature on Android).
Analyze user interactions on your website and native mobile app in the same tool
After you set up Smartlook’s tracking snippet on your native mobile app, Smartlook will begin automatically tracking all user interactions, including screen taps, button clicks, and form inputs. You can also set up custom events and custom properties to monitor user interactions more precisely. Just like with the website analytics platform, you can use both standard and custom events on mobile to create funnels and to filter session recordings.
Smartlook supports a much wider range of mobile development frameworks than most mobile session replay tools, with SDKs for iOS, Android, React Native, Unity, Unreal, Flutter, Cocos, Cordova/Ionic, and Xamarin.
A good example is our client that develops Hookle – a social media management app built with Flutter. Hookle resigned from UXCam and chose Smartlook because our tool is intuitive and integrates well with Flutter technology.
Funnel analysis shows you where users drop out of any conversion funnel
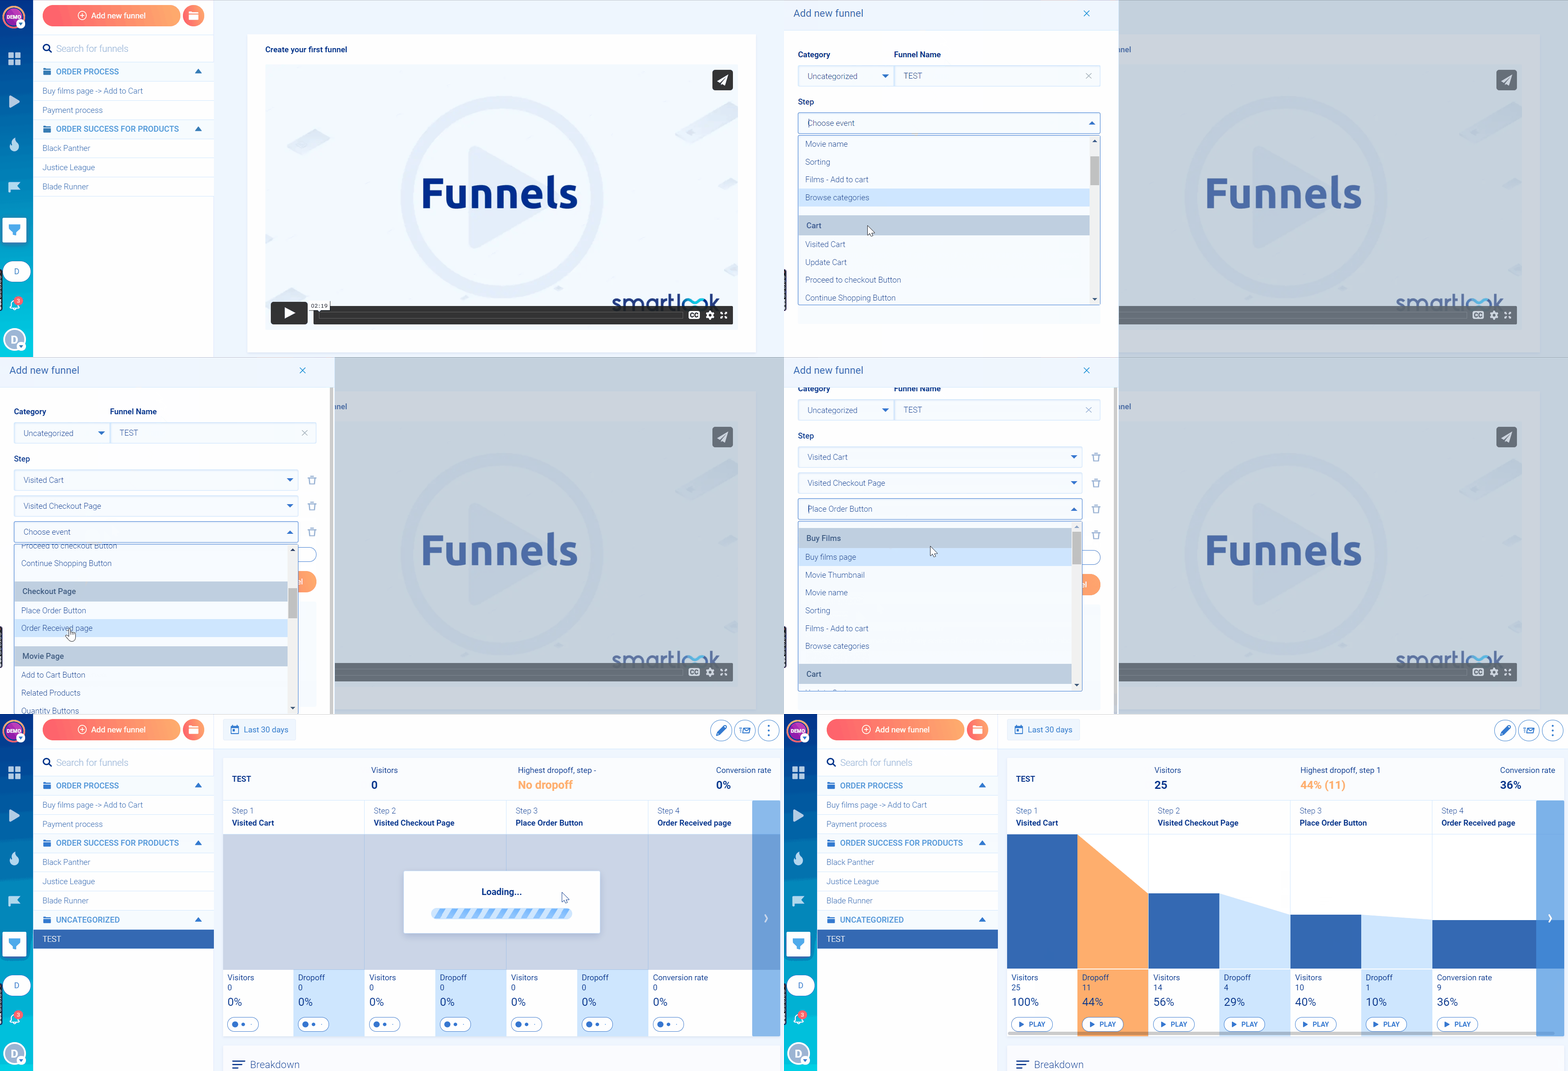
In Smartlook, a funnel is made up of any 2 or more events and tells you how many users who did 1 step (an event) went on to also do the next step (a different event). Smartlook’s funnel analysis feature automatically calculates the conversion rate between each step and creates a visualization for you that highlights the step with the highest drop-off.
You can view the same kinds of breakdowns for each step of the funnel as you can in the events manager, and you can also watch the recordings of users who dropped out at each step.
Resolve customer support issues faster with session replay
Customer success teams love Smartlook’s session replay feature because it helps them solve their clients’ inquiries faster. Using Smartlook’s API, you can identify users and look up customer’s replays by their name or email. Without involving any developers, customer success teams can use this feature to watch the sessions of users who submit tickets to determine if there’s a real bug or if it’s just a user error.
For one of our customers, session replay helped them resolve a problem that a user faced again and again, submitting ticket after ticket. For weeks, customer support tried to solve the problem based on the user’s explanation of what was going on, with no success. But when a team member reviewed replays of that user’s sessions in Smartlook, they realized the user wasn’t describing what was happening accurately. Once they watched the user’s actual behavior in the session recording, they were able to solve the problem immediately.
Find and fix errors faster
Smartlook automatically tracks JavaScript errors and rage clicks (users repeatedly clicking on a particular element) as events. Both of these types of events typically represent broken or confusing elements in the UI, but they’re not always issues that customers will complain about.
Being able to watch the recordings of these events can help developers proactively find bugs and fix them faster. There’s no need to spend time manually recreating the bug because the session recording captures all the relevant steps that happened before the bug appeared and the details of the device type, operating system, and location — all details that can make it easier to fix the issue for your users.
To see all of Smartlook’s product analytics features in action on your own site, create a free account. You’ll have access to all of our premium features for the first 30 days, and then you’ll be automatically switched to our free forever plan.
FullStory: Watch session recordings, create funnels, and segment users
When it comes to session recording, FullStory’s offerings are very similar to Smartlook.
How it collects data:
FullStory auto-collects all interactions after you install one snippet, meaning it’s fast to set up, and you can retroactively define events.
What events it collects:
Out of the box, FullStory starts recording click events, which allow you to filter user sessions by users who click on anything, or on a specific piece of text, or on a specific CSS selector (like a button).
FullStory doesn’t offer as much freedom to define custom events as Smartlook. If you want to track events other than standard clicks, page views, or text inputs (or taps, scrolls, screen elements, and customer engagement statistics on mobile apps), you need to import them from another tool through FullStory’s API.
Support for native mobile apps:
Another significant difference between FullStory and Smartlook is its support for native mobile apps. While FullStory does offer session recordings for mobile, its product analytics tools for mobile are very limited because of its inability to define custom events. Whereas with Smartlook, you can define any and all events in a native mobile app by using custom events; however, the only metrics for mobile apps available in FullStory are:
- Number of unique users who performed a specific activity (event).
- The average time from session start until users perform a specific activity (event).
- Number of crashed events when the platform is a mobile app.
This makes FullStory a great platform for teams who only care about analyzing user behavior on a website or web application, but not as well suited for teams with both web and native mobile products.
UXCam: Session replay and event analytics for mobile apps
UXCam is a user experience analytics platform for mobile apps that offers session replays, heatmaps, funnel analytics, and event analytics. Unlike Smartlook, it doesn’t have an analytics platform for websites and web apps.
How it collects data:
UXCam automatically begins capturing recordings of all user sessions after you complete the SDK integration, which should take a developer about 30 minutes.
What events it collects:
The only user interaction events UXCam collects by default are rage taps. Out of the box, UXCam also tracks application crashes, average session time, and active user count. You have to set up custom events to get any other user behavior data, but once you do, you can add those events to funnels and use those events to filter session recordings.
Support for native mobile apps:
While UXCam exclusively supports mobile apps, it doesn’t support as many mobile development frameworks as Smartlook. UXCam supports the following frameworks:
- iOS
- Android
- React Native
- Cordova
- Xamarin
- Flutter
- Unity (only for iOS)
- NativeScript
UXCam is a great tool for helping SaaS companies identify usability problems in mobile apps, track performance metrics, and make informed design choices, but it doesn’t support analytics for websites or web applications, so companies that need to track user behavior across a variety of frameworks will need to use multiple tools.
Behavioral analytics tools that only offer event-based analytics
Tools in this category focus exclusively on capturing every user interaction event, giving you seemingly endless ways to break down and compare the data, which can help you find correlations between events, notice anomalies, and identify trends in user behavior that may indicate problems with the user experience. But, notably, these tools don’t have session replay capabilities.
Once you’ve found an interesting user behavior pattern or anomaly in the product data, it can be a pain to figure out why it’s happening if you don’t have access to a session replay tool. You’ll inevitably have questions that the numbers alone can’t answer, but this can often be easily answered by watching the sessions of users who interacted with the new feature.
That’s why many product teams start with a tool like Smartlook, and add-on 1 of the tools from this list if they outgrow its event-based analytics capabilities.
Heap: Auto-capture every user interaction
How it collects data:
Like Smartlook, Heap is very easy to set up. You just add a snippet of tracking code to your header, instead of having to instrument each event like you do with the next 2 tools in this list. That means you don’t need technical team support to set it up or use it on a daily basis, and you can define events retroactively and immediately do analysis on those events.
What events it collects:
Heap captures every user action taken on a website. For each event you define, you can see things like which pages people were on, what element they clicked on, the color of the button, the target text on the click, the actions users took before and after clicking, the users’ titles, what other actions users who click that button tend to take, and more.
Support for native mobile apps:
Heap does not work for native mobile apps because it doesn’t offer a way to define custom events
Mixpanel: Self-serve event-based analytics for web and mobile
How it collects data:
With Mixpanel, you have to proactively set up tracking of individual events. They recommend creating a tracking plan at the beginning to make sure you’re tracking what you want. This means it is tedious to set up and requires ongoing maintenance by developers to make sure it’s properly tracking events as your product evolves.
It also means you can’t retroactively define events. If you realize you’re not tracking something important, you will have to wait for developers to add that tracking code to the feature or element, and then wait for data to come in.
What events it collects:
While it’s more time-consuming to set up Mixpanel, its tracking and analytics capabilities are quite impressive. It can collect every conceivable user interaction event and offers tons of ways to analyze and compare them.
However, in many cases, when you find something interesting, you’re going to want to watch a session recording to get the why and context behind what’s happening. For this reason, Smartlook offers an integration with Mixpanel that allows you to see visitor recording URLs in your Mixpanel event feed and go directly to them to see the full user session.
Support for native mobile apps:
Mixpanel supports native mobile apps, offering the same features for both web and mobile.
Amplitude: Analyze detailed behaviors, user attributes, channels, and more
How it collects data:
Like Mixpanel, with Amplitude, you have to proactively set up tracking of individual events, so it has the same downsides in terms of technical talent required and not being able to retroactively define events.
What events it collects:
Amplitude is easily the most comprehensive product experience analytics solution. As a digital intelligence platform, it can do any kind of event-based analysis and comparison you can imagine, but it’s very tedious to set up and overwhelming to use on a daily basis, making it more suitable for data scientists and teams who have access to ongoing developer support.
Support for native mobile apps:
Amplitude supports native mobile applications.
User engagement tools that also offer event-based analytics
The 2 tools in this category can be considered product analytics solutions because they collect data about user interactions in order to help customer success teams understand user engagement and encourage adoption of new features.
However, since the focus of these tools is more on user engagement, roadmapping new features, and encouraging user adoption of those features, the event-based analytics capabilities of these tools in this list tend to be less robust than the tools in the previous categories, making most product teams turn to a second tool to analyze user behavior.
Pendo: Understand customer experience and encourage digital product adoption

How it collects data:
Without the need for any code, Pendo collects every feature click, screen, and page load and offers retroactive event definition for those types of events. It’s most known for its tools that guide users through your app, like targeted suggestions and pop up messages that encourage users to complete onboarding steps or try new features. Built-in user feedback tools help teams manage customer feature requests.
What events it collects:
Pendo’s event tracking is less robust than most behavioral analytics tools. It can show you basic stats about an event, like how many users clicked on a specific button. But more advanced analytics tools can help you understand what other actions took before or after that click, and see many other attributes about each user journey.
Support for native mobile apps:
Pendo supports native mobile applications, but reviewers mention that the mobile analytics functionality is not as complete as the features for web applications.
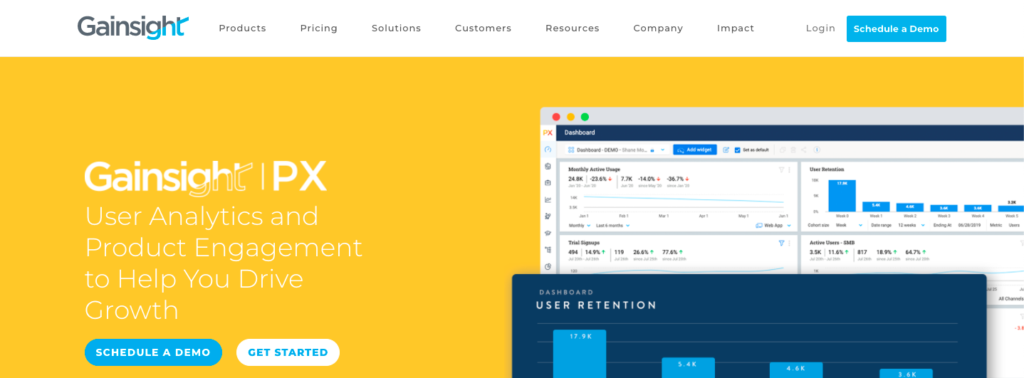
Gainsight PX: Understand the digital experience and drive adoption
How it collects data:
Gainsight PX offers auto-tracking with its JavaScript code snippet.
What events it collects:
Similar to Pendo, Gainsight PX is a user analytics tool with a focus on product engagement and product adoption, but it’s more enterprise-focused.
Most often used by customer success teams to improve user engagement and prevent churn from existing users, but not as useful for product teams to understand overall user behavior. However, you can track every step of the customer journey and understand how users are moving through and interacting with your product.
Support for native mobile apps:
Gainsight supports native mobile apps.
Get started with product analytics from Smartlook for free
Smartlook’s combination of event tracking and session recording features can help you analyze the performance of your product, understand customer behavior across multiple platforms, and quickly fix issues.
Schedule a demo or start our free 30-day trial to start seeing your website through the eyes of your visitors.


