When users interact with any of your online properties, including your website, mobile app, or social media profiles, they create valuable data that you can use to understand their behavior and improve their experience.
That’s the purpose of digital analytics — to collect and analyze data from these different sources in order to make educated decisions.
However, a wide variety of software solutions fall under this definition. Any software that pulls data from a digital property and organizes it into a convenient view can be considered a digital analytics solution.
In this guide, we’ll help you understand the differences between these tools and find the right one(s) for your needs. To do so, we’ve organized the top 12 digital analytics tools into four categories:
- Web and mobile analytics tools: Smartlook, Amplitude, Mixpanel, Adobe Analytics, Google Analytics, and Clicky. These tools help you analyze how users interact with your website, web app, and native mobile app.
- Social media management and analytics tools: Hootsuite and Sprout Social. These tools let you manage your social media presence and analyze how users engage with your social profiles.
- Search engine optimization (SEO) tools: Semrush and Ahrefs. These tools help you monitor your website’s organic traffic, analyze its link profile, and track rankings for important keywords.
- Customer relationship management (CRM) systems: Salesforce and HubSpot. These tools can keep all your customer interaction data in one place, so you can use it to analyze interactions, manage relationships, and close deals.
We’ll explore key aspects of each tool, including its most important features, use cases, pricing plans, and more.
Smartlook captures every user interaction on your website or mobile app with a single code snippet and lets you create heatmaps, define events, build funnels, and watch session recordings. You can try Smartlook today with our full-featured, 30-day trial — no credit card required.
Web and mobile app analytics tools
These tools help companies analyze how users interact with their products by gathering traffic and behavioral data from websites, web apps, and native mobile apps. They’re crucial for marketers and product teams looking to:
- Understand how users navigate a page or app screen.
- Monitor which sources bring in traffic to their site or app.
- Segment their user base by their characteristics and behaviors.
- Find points of friction in key flows, like checkouts and onboarding tutorials.
- Calculate and improve key metrics like conversion rates, churn, and retention.
1. Smartlook
- Key features: Session recordings, heatmaps, events, funnels, behavior flows, and crash reports.
- Supported platforms: Web and mobile apps.
- Pricing: Starts at $55/month for recording 5,000 monthly user sessions on your site or app. There’s also a free forever plan you can use without a time constraint or credit card.
Smartlook is our product analytics and visual user insights platform that combines key quantitative and qualitative analytics features, including:
- Session recordings, which let you watch users’ exact experience on your site or app. Suggested reading: How to record website visitors: Practical tips, tools & examples
- Heatmaps, which give you an overview of the typical user experience on a page or app screen. Suggested reading: How to read a heatmap and get actionable UX insights
- Events, which are user actions that you can track over time, like page visits, button clicks, or successful purchases.
- Funnels, which let you analyze how users navigate flows like checkouts, onboarding tutorials, and newsletter signups. Suggested reading: How to improve conversions, retention & UX with funnel analysis
- Behavioral flows, and much more.
You can use this versatile feature set to capture everything your users do and, more importantly, uncover why they do it, so you can improve their experience, as well as your conversions, retention, and revenue.
Smartlook also supports a wide range of website, web app, and native mobile app technologies, including WordPress, Shopify, Wix, Webflow, iOS, Android, Flutter, React Native, and more. This, alongside its multifaceted feature set, makes Smartlook one of the most versatile digital analytics software tools on the market.
In the next sections, we’ll discuss three key benefits of using Smartlook to analyze user behavior.
Record all user interactions on your site or app with a single code snippet
Smartlook automatically records all user interactions on your site or app.
All you have to do is add one code snippet and our platform will automatically start recording users’ sessions. You can find them in the “Sessions” tab of your dashboard, as shown below.

As you can see, there’s a “Play” button next to each session. Clicking it takes you to a video (also called a session recording or session replay) that recreates everything that happened during that session — including which pages or app screens the user visited, which buttons they clicked, the error messages they saw, and so on.
For example, the screenshot below shows a session recording of a user navigating an onboarding tutorial.
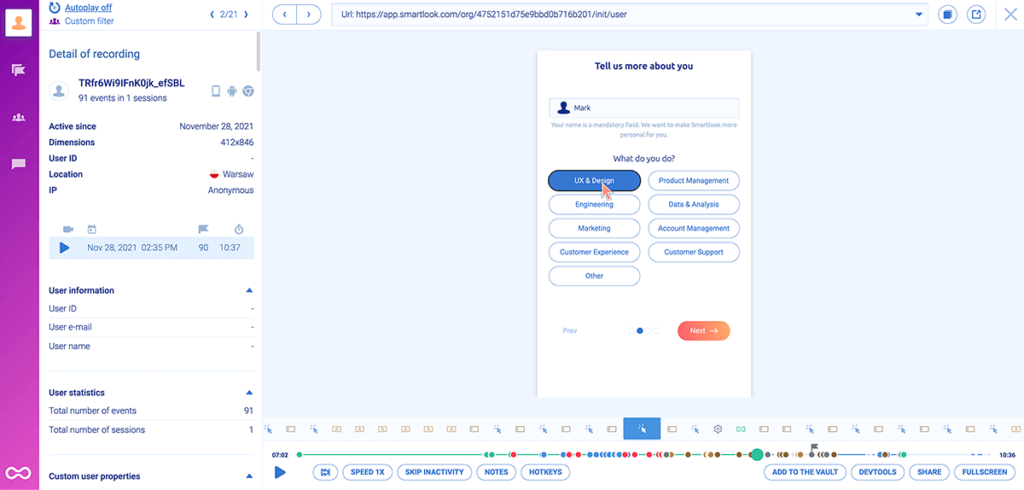
Besides the video itself, there’s also tons of useful information, including:
- The user’s device, country, and other sessions (to the left).
- A timeline of all events they triggered during the sessions (under the video).
Session recordings can be a powerful tool for marketers, product teams, customer support specialists, UX researchers, and developers. If you haven’t worked with session recording software before, check out our in-depth review of the top 8 session replay and visitor recording tools.
Besides session recordings, you can also start using Smartlook’s other analytics features immediately after adding our code snippet.
For example, you can create heatmaps to see where users click, scroll, or move their mouse on a web page or app screen. The screenshot below shows a Smartlook click map that highlights the areas where most clicks were concentrated.
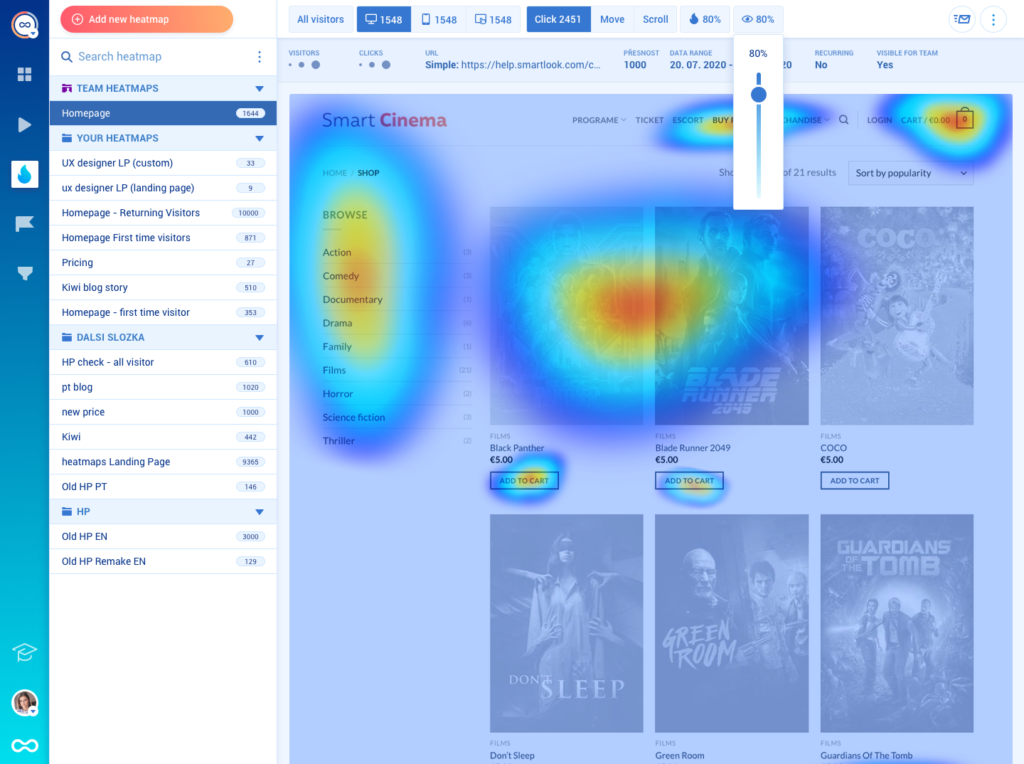
Because they’re so easy to create and intuitive to read, heatmaps are a great place to start your user behavior analysis. If you haven’t worked with them before, we highly recommend checking out our guide to heat mapping.
Analyze aggregate stats and metrics or zoom into individual user sessions
With Smartlook, you can easily move from high-level metrics to the sessions of individual users (or user segments) to find concrete points of friction or opportunities for improvement.
Here’s how.
When you open Smartlook, you’ll get a dashboard full of useful stats and metrics about your site or app, including:
- The top visited and exit pages.
- Users’ browsers, devices, and countries.
- New versus returning users.
- The most common errors, and much more.

These dashboards are easily customizable, so they can include any information that’s relevant to your business.
For example, if you have an e-commerce site, you may want to track key marketing data, like the conversion rate for your checkout flow or the number of visitors to a product page. Or, if you have a SaaS app, you may want to track product metrics like the number of daily, weekly, or monthly active users.

If you want to get more specific, you can start watching individual session recordings, as we showed in the previous section. Smartlook makes it easy to find the sessions you need with over 30 filters, including:
- Dates.
- Users’ devices.
- Their countries and IPs.
- The events they triggered, and much more.
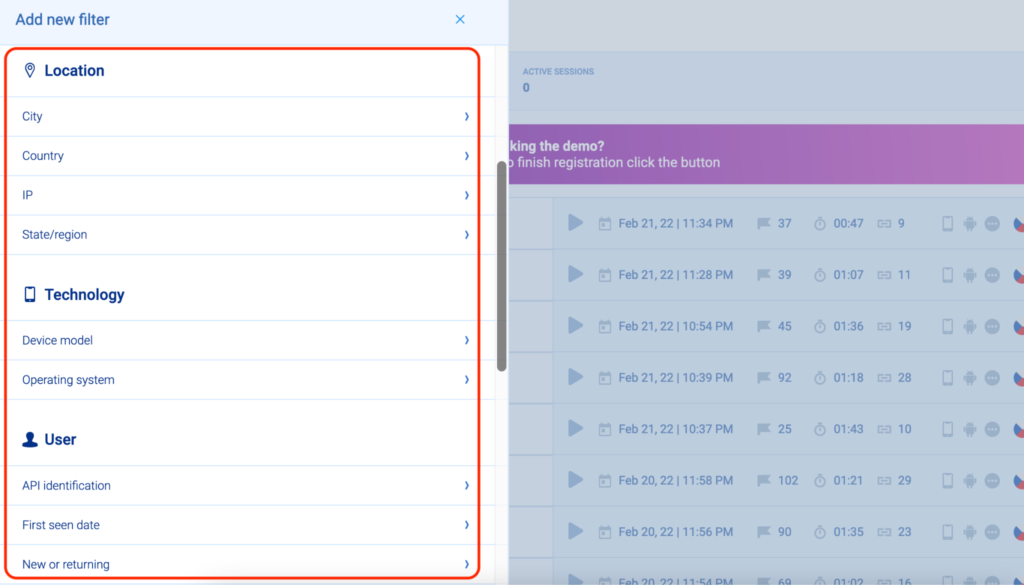
Additionally, you can locate session recordings of specific users by a unique identifier, like their names or emails. All you have to do is set up our Identify API and users’ identifiers will appear in their session recordings, as you can see in the lower left hand corner.
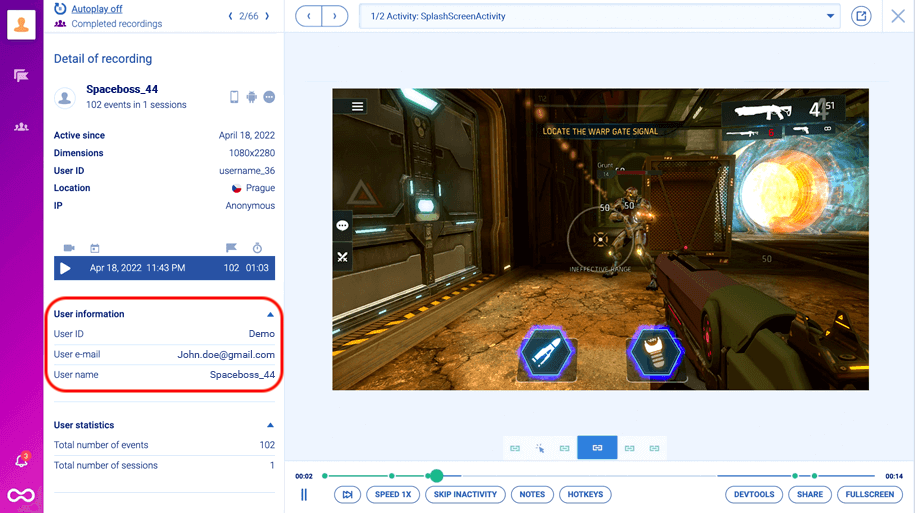
This capability can be extremely useful for user experience (UX), product, digital marketing, and customer support teams. For example:
- Marketers, product managers, and UX researchers can easily find the sessions of important users (e.g., high-paying customers) and come up with ways to improve the customer experience.
- Customer support teams can jump into the sessions of users who reported a bug to see exactly what happened, without bothering people for an explanation.
Combine quantitative data with qualitative product experience insights to improve your conversion rates
Smartlook can help you quantify user behavior with:
- Events, which let you monitor how often users perform certain actions, like button clicks, page visits, purchases, and more. Plus, Smartlook makes it easy to track events without coding by simply choosing from a list of template events or directly clicking on your site’s user interface (as shown below).

- Funnels, which let you calculate conversion rates and track how users navigate key flows, such as checkouts and onboarding tutorials. Building a funnel in Smartlook is as simple as placing events in the order you believe your users follow (the process is shown in the GIF below).
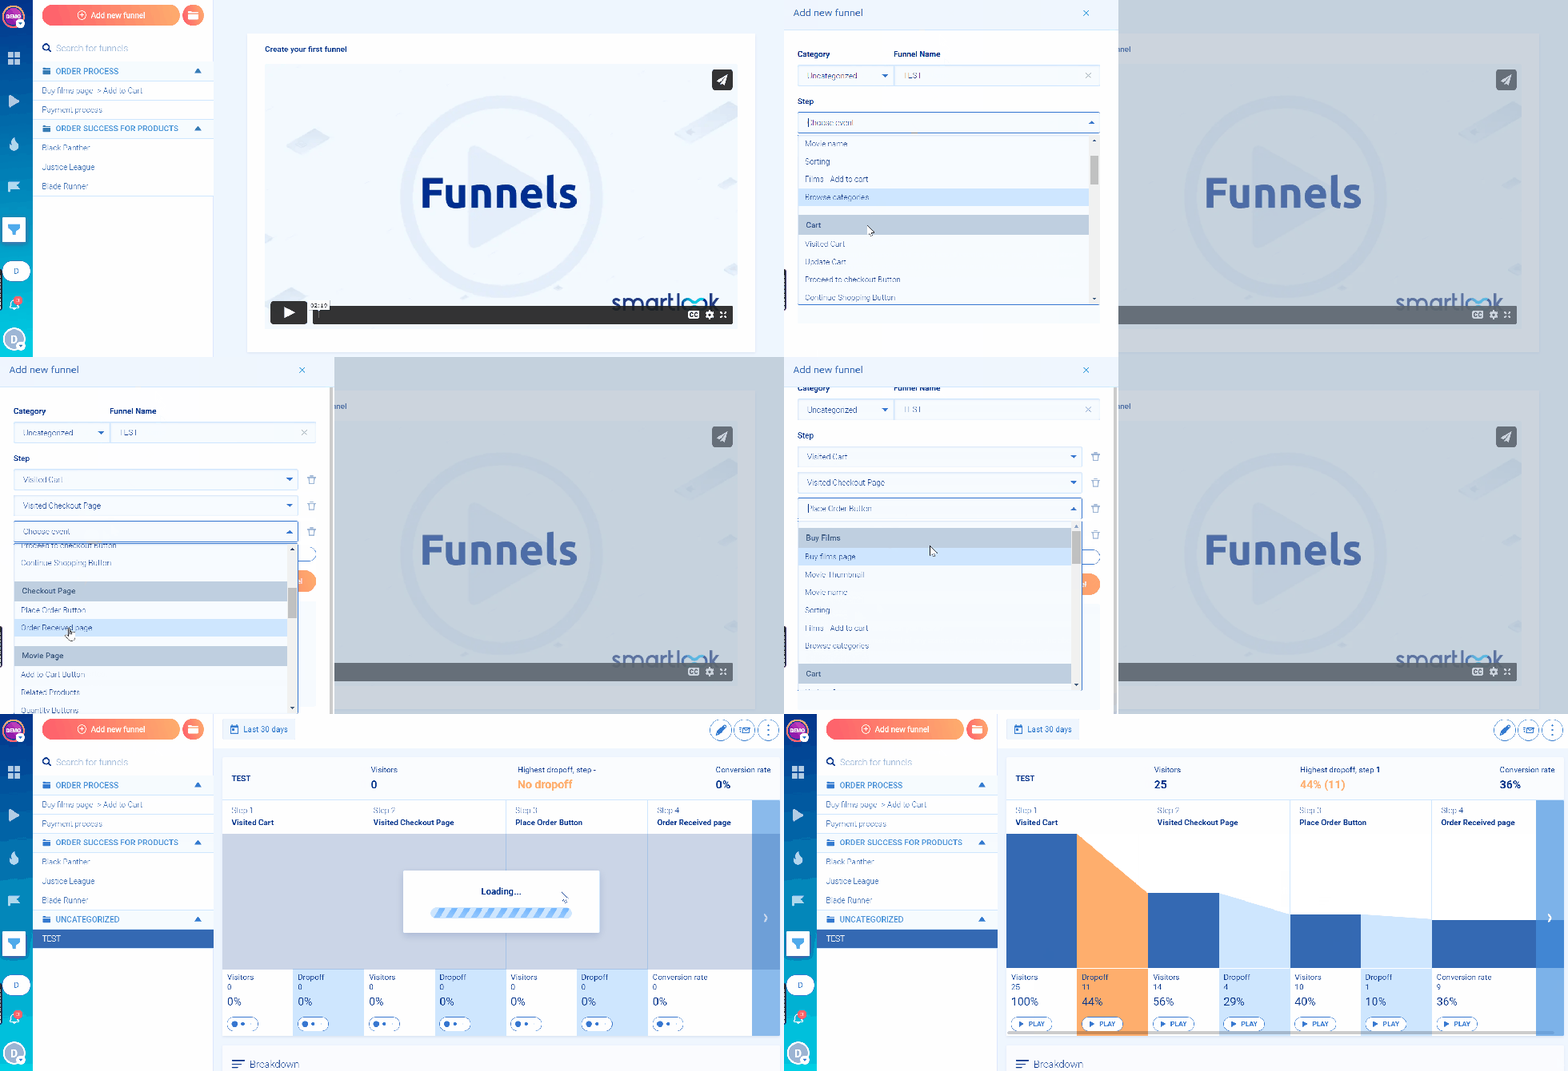
Both of these capabilities are essential for marketing and product teams but they’re often not enough to find exactly what’s hurting your users’ experience and conversions. That’s why Smartlook can combine event tracking and funnel analysis with session recordings to uncover the “why” behind users’ behavior.
You can instantly find all sessions where users triggered a certain event by simply clicking on the “Play” button next to its name.
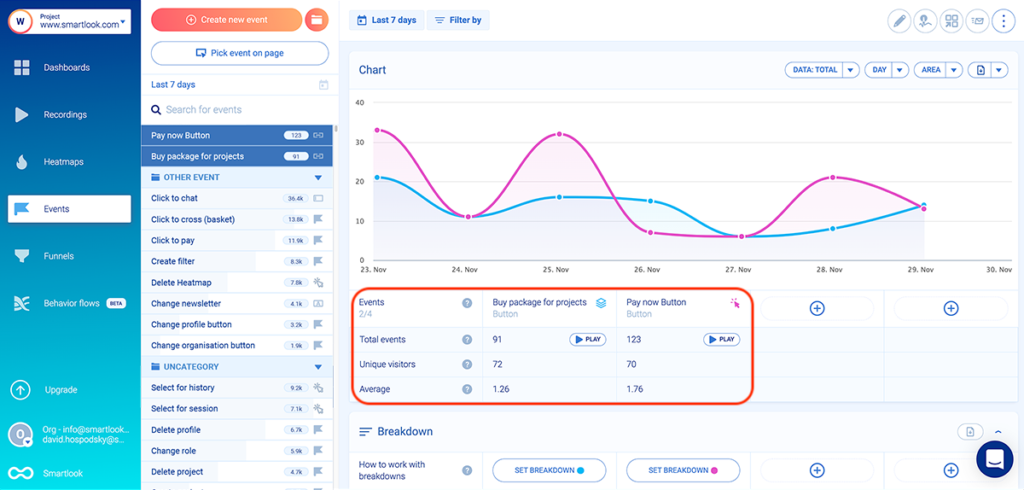
This capability makes it much easier to find relevant sessions and see the full context behind certain actions.
Additionally, each step of your funnels, including the drop-offs, also has a “Play” button, which takes you directly to the relevant recordings. As a result, you have a much easier way to find points of friction in your flows.
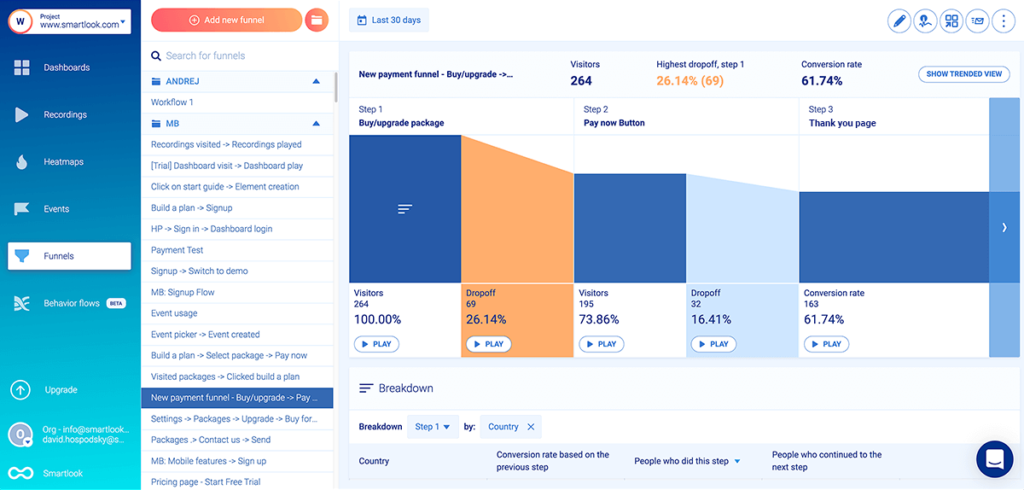
For example, in the funnel above, 32 users dropped off after clicking the “Pay now” button and didn’t reach the “Thank you” page. In theory, this shouldn’t happen, but in practice, a whole range of technical issues can prevent users from checking out. By clicking on the “Play” button under the drop-off, you can quickly watch a few relevant session recordings and see the issue, instead of guessing what it is or trying to reproduce it via trial and error.
AstroPay — one of our fintech clients — used this exact process to massively improve the conversions of one of their key flows. They simply created a funnel, saw where the drop-offs were, and jumped into the relevant sessions. This revealed two points of friction, which AstroPay’s team fixed, resulting in a 56% increase in their conversion rate.
For more details on how Smartlook can benefit your business, book a free live demo with our team. Or, if you want to give Smartlook a go yourself, sign-up for a full-featured, 30-day free trial — no credit card required.
2. Amplitude
- Key features: Event tracking, funnel analysis, segmentation, retention analysis, and data unification.
- Supported platforms: Web and mobile apps.
- Pricing: Available upon request. There’s a free plan with basic product analytics functionality.
Amplitude is a product analytics and event tracking platform. It’s comprised of a few different tools:
- Amplitude Analytics, which provides customer behavior insights and lets brands perform complex data analysis.
- Amplitude Experiment, which lets brands run A/B tests and improve conversion rates.
- Amplitude CDP, which connects to multiple data sources and unifies customer data into a single, user-friendly view.
Overall, Amplitude is among the most powerful but most difficult-to-use analytics platforms due to its manual data collection and complex features. We’ve explored this issue in more detail in our comparison article for Amplitude, Mixpanel, and Smartlook.
3. Mixpanel

- Key features: Event tracking, funnel analysis, retention analytics, segmentation, and cohort analysis.
- Supported platforms: Web and mobile apps.
- Pricing: Starts at $28/month for tracking 10,000 events per month. There’s also a free forever plan.
Mixpanel is a popular product analytics tool for analyzing user behavior and helping product teams power their decision-making process with reliable data. They recently underwent a rebranding and expanded their use cases with a bigger focus on tracking marketing campaign performance and new features like root cause analysis.
Despite its popularity, Mixpanel has a steep learning curve and doesn’t offer any qualitative analytics features. As a result, some teams opt to look for simpler competitors and alternatives to Mixpanel.
4. Adobe Analytics

- Key features: Real-time data insights, attribution tracking, predictive analytics, and native integrations with the rest of Adobe’s suite.
- Supported platforms: Web and mobile apps.
- Pricing: Available upon request.
Adobe Analytics is an enterprise analytics platform that’s part of the Adobe Experience Cloud. It has both basic and advanced analytics capabilities, like segmentation, metric tracking, and predictive analytics. It also has three pre-made plans for different use cases — Select, Prime, and Ultimate — although there’s no publicly available pricing for either of them.
5. Google Analytics

- Key features: Event tracking, acquisition and attribution tracking, funnel analysis, and path exploration.
- Supported platforms: Web.
- Pricing: Google Analytics is free.
Google Analytics (GA) is the most popular marketing analytics tool on the market. It’s the default option for most website owners looking to monitor their traffic, understand their visitors (demographics, devices, countries, etc.), track metrics like bounce rate, and make data-driven business decisions.
At the same time, GA is also limited in the sense that it only tracks aggregate stats and metrics and doesn’t have any qualitative analytics features (like surveys or session recordings). These drawbacks often prompt teams to look for an alternative to GA.
6. Clicky
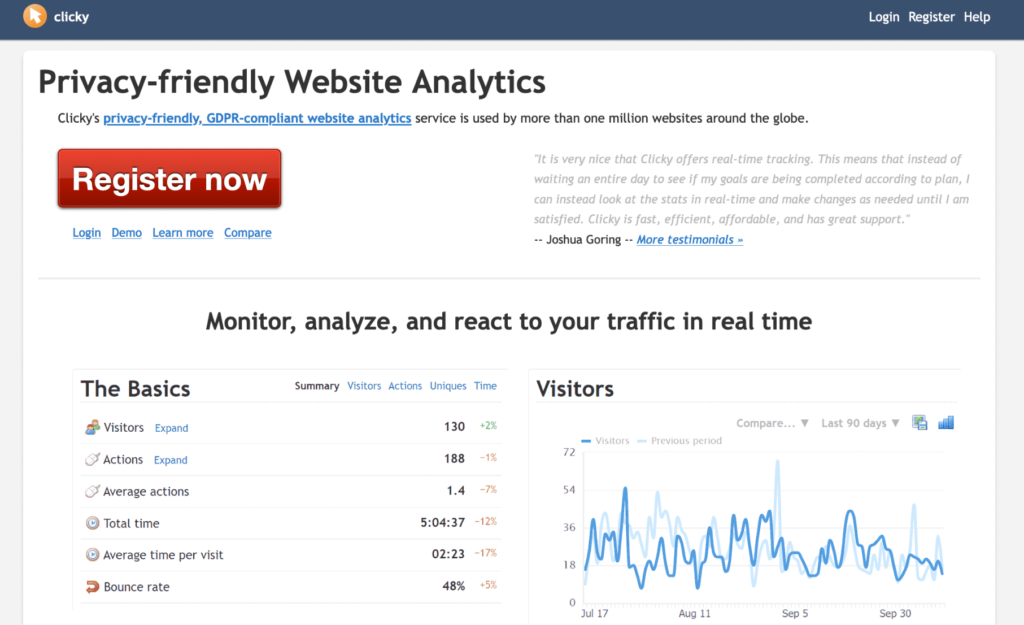
- Key features: Real-time traffic tracking, heatmaps, uptime monitoring, and anti-fraud capabilities.
- Supported platforms: Web.
- Pricing: Starts at $9.99/month for websites with up to 30,000 daily pageviews. There’s also a free plan for sites with up to 3,000 daily pageviews.
Like GA, Clicky is a more traditional quantitative website analytics tool that helps brands monitor their website traffic in real-time. However, Clicky also offers some additional features like heatmaps and uptime monitoring, which slightly expand its scope beyond traditional web analytics. Its cost-effective pricing also makes it a popular choice for small businesses.
Social media management and analytics tools
These tools help organizations manage their social media presence by organizing data from their social media profiles into a single place. They’re typically used by social media marketers who want to:
- Plan and schedule their posts.
- See what their users are saying on social media.
- Analyze how people interact with their posts and find ways to boost engagement.
7. Hootsuite
- Key features: Social media engagement analytics, publishing calendar, social listening, and AI-generated texts for social media.
- Pricing: Starts at $99/month for 10 social accounts. All paid plans have a 30-day free trial.
Hootsuite is a social media management platform. It has a writing assistant (powered by machine learning) that helps social media marketers generate ideas for new posts or repurpose their existing content. Their analytics suite helps you track metrics from different social media platforms and build data-driven marketing strategies.
8. Sprout Social

- Key features: Social media analytics, pushing and scheduling, social listening, and employee advocacy.
- Pricing: Starts at $249/month for five social profiles. There’s a 30-day free trial for all plans.
Sprout Social is a comprehensive social media platform. It helps brands analyze results from their Instagram, Facebook, TikTok, Twitter, YouTube, LinkedIn, and Pinterest accounts and create custom analytics dashboards. It also offers a unified inbox, so customer support agents don’t have to switch between tabs when talking to users on different social platforms.
Search engine optimization (SEO) tools
These tools crawl the web and provide insights into the organic ranking performance of websites or individual pages. This makes them invaluable for SEO professionals looking to:
- Monitor their site’s organic traffic.
- Track where certain pages rank for specific keywords.
- Analyze their site’s link profile, including backlinks and broken links.
9. Semrush
- Key features: On-page SEO suggestions, keyword research, competitor analysis, pay-per-click (PPC) ad research, and PR monitoring.
- Pricing: Starts at $119.95/month for five projects and 500 tracked keywords. You can also create a free account to use a limited version of the tool.
Semrush is a platform that can help you improve your paid and organic search results. It can analyze data from your site and ad accounts to help you find opportunities for new content, Google Ads keywords, and content distribution. It can also pull data from the web to help you analyze competitors’ sites, organic search performance, and social media presence.
10. Ahrefs

- Key features: SEO dashboard, keyword tracker, site explorer, organic position history tracker, and backlink analysis.
- Pricing: Starts at $99/month for up to 5 unverified projects and 750 tracked keywords. Two of Ahrefs’ tools — Site Explorer and Site Audit — have free versions.
Ahrefs is an SEO platform with products for monitoring and improving your organic traffic. You can connect your website to it and analyze your organic ranking performance for key queries. You can also use it to analyze data from the web — including keyword search volumes, competitor rankings, backlinks, and much more.
Customer relationship management (CRM) systems
These final tools pull customer interaction data from multiple sources — like email and live chat — and organize it into a single source of truth for all customer interactions. Sales, customer support, and marketing teams use CRMs to:
- Track all interactions customers have with their brand.
- Manage customer relationships through the entire customer journey.
- See the status of potential customers in the pipeline (first meeting, negotiations, contract signing, etc.)
11. Salesforce

- Key features: Customer 360 CRM, sales and marketing clouds, customer data platform, and customer service software.
- Pricing: Varies depending on the products you need. The CRM starts at $25/user/month, with a free trial that doesn’t require a credit card.
Salesforce is the category-defining CRM. They made the term CRM popular over 20 years ago and remain a leader in the space until today. While you can use Salesforce to just monitor and nurture customer relationships, it also offers a plethora of other products for use cases like data unification, order management, and more.
12. HubSpot
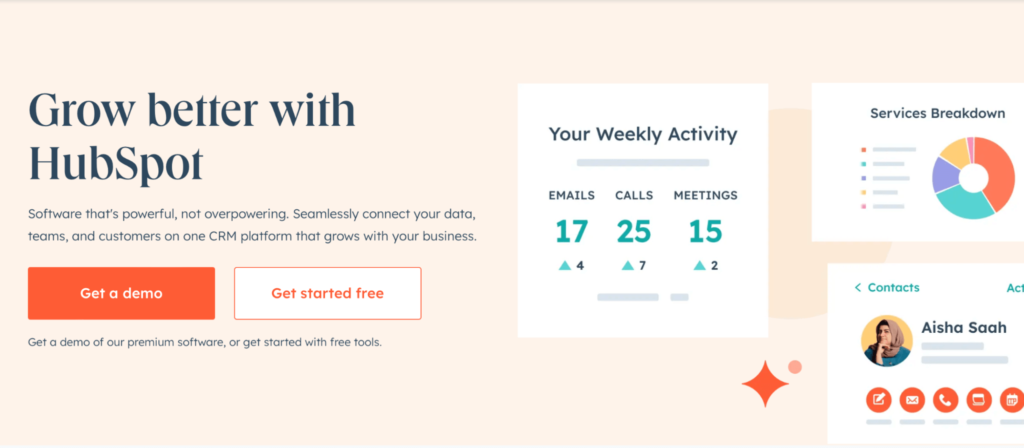
- Key features: CRM platform, marketing and sales hubs, content management system (CMS), and operations software.
- Pricing: Varies depending on the products you need. The CRM suite for small teams starts at $50/month. There’s also a free plan that comes with basic sales, marketing, and operations tools.
HubSpot is a CRM platform that helps teams connect their sales, marketing, and customer service operations. It brings together tons of different tools, while also offering a generous free tier. Each of its products can be purchased separately, so you can try its CRM if you’re only interested in bringing together customer interaction data or expand to use cases like content marketing, marketing campaign automation, and more.
Capture everything your website or mobile app users do with Smartlook
Smartlook is the only combined product analytics and visual user insights platform that won’t take your team forever to set up. You can use it to gather user behavior data from your websites, web app, or native mobile app with minimal to no intervention from your team.
You can see Smartlook in action without spending any time registering or setting it up. Just book a free demo using this form and our team will give you a detailed Smartlook presentation that’s tailored to your business. Customers leave positive feedback about our demos 99% of the time, so you’re bound to learn something useful from our team.
Lastly, you can also give Smartlook a go yourself by signing up for a full-featured, 30-day trial of Smartlook today (no credit card required).


