While Google Analytics (GA) is the most popular tool for collecting website traffic data, it has big limitations when it comes to analyzing user behavior. Specifically:
- GA doesn’t track all important user interactions (events) automatically. Instead, you’re often required to set up event tracking via code changes or with Google Tag Manager, which is difficult and time-consuming. As a result, there’s always a delay between realizing you need to analyze a particular action and having the data to do so.
- Due to its lack of qualitative analytics features, GA can only tell you what users do, but not why they do it. For example, GA can show which step in your checkout process leads to most cart abandonments. However, you can only guess why that is, as there’s no way to watch users’ sessions.
These limitations can prevent you from finding and fixing the issues that hurt your user experience (UX) and conversion rates. Additionally, GA’s GDPR compliance problems and steep learning curve also lead many users to look for an alternative solution.
In this article, we’ll show you how our platform — Smartlook — can help you overcome GA’s limitations. Specifically, you’ll learn how Smartlook automatically captures all user sessions and interactions on your site or mobile app. We’ll also show you how to combine quantitative and qualitative data to find insights for improving your UX and conversion rates.
Lastly, we’ll compare 12 other best Google Analytics alternatives.
Best Google Analytics Alternatives
- Smartlook
- Clicky
- Matomo
- Piwik PRO
- Woopra
- Mixpanel
- Heap
- Fathom
- Plausible
- FoxMetrics
- GoSquared
- Kissmetrics
- Adobe Analytics
Try out Smartlook for free with our full-featured 30-day trial (no credit card required). Our tool captures every user interaction on your website or mobile app and lets you watch session recordings, define events, build funnels, create heatmaps, and much more.
1. Smartlook: Our product analytics and visual user insights platform provides you with tools to minimize personal data collected through the platform.
Smartlook is the only combined product analytics and visual user insights platform that won’t take your team forever to set up.
Our platform comes with four key features — session recordings, events, funnels, and heatmaps. With this unique feature set, you can do both quantitative and qualitative analytics, allowing you to uncover what users do and why they do it.
Let’s look at three ways our customers use Smartlook’s features to analyze customer behavior and find actionable insights fast.
#1 Record all user sessions on your site or mobile app with a single code snippet
Session recordings (sometimes called session replays) capture a user’s entire session on your site or mobile app, with every interaction in it. This means you get to see the full context behind users’ actions, which helps you understand why they do what they do.
Once our code snippet is installed (for websites) or the SDK is set up (for mobile apps) Smartlook starts recording all user sessions, which means:
- Every session is automatically captured for you (no sampling), so you don’t have to manually start and stop the session recorder.
- You won’t be missing important data when analyzing your users’ behavior.
- You can create events and funnels retroactively.
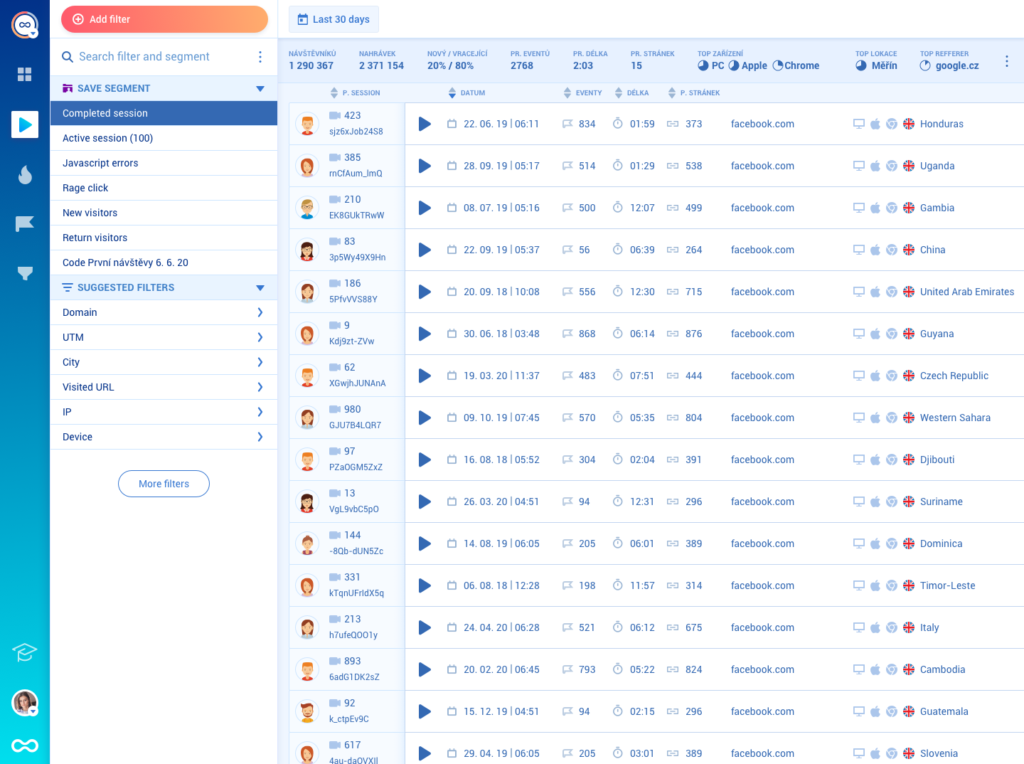
Smartlook also has 30+ filters, like device, operating system, country, IP address, and more, which help you find relevant sessions fast. With Smartlook, you can always find the precise session you need, when you need it — no more wading through a sea of session recordings.
Additionally, Smartlook tracks JavaScript errors and rage clicks by default, allowing you to instantly find session replays of users who were frustrated or experienced an error. One of our clients used session recordings to find 15 bugs on their website in three hours.
As we said, Smartlook offers a range of features to safeguard your users’ data. Specifically:
- Passwords and credit card information are never captured by our session recorder.
- You can mask and exclude elements from appearing in session replays.
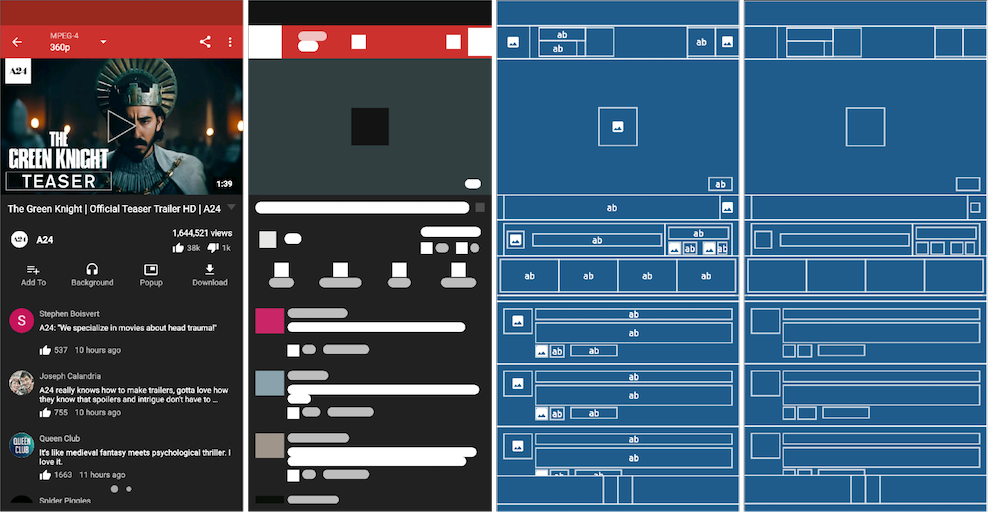
- For mobile apps, we also offer wireframe rendering modes. When one of these modes is enabled, Smartlook doesn’t capture the UI as your users see it. Instead, it replaces it with an abstract representation of the content of the screen, so no personal data is ever recorded by our tool.
#2 Track user actions (events) and build event-based funnels without coding
Tracking specific interactions is vital for understanding your users’ behavior. In GA (and most other web analytics tools) these interactions are called events.
While it’s possible to track events with GA, there are two big problems:
- Setting up event tracking often requires programming skills and the use of an extra tool — Google Tag Manager.
- GA starts tracking user actions as events only after you set up tracking. As we said, this means there’s always a delay between realizing you need to track a user interaction and having the data to do so.
GA4 made some progress in this area by tracking more events automatically. However, in a lot of cases, event tracking still needs to be set up manually by a developer.
In contrast, once Smartlook is set up, it automatically starts recording all user interactions (via the session recordings we discussed above) and lets you track events without coding.
Automatically recording all user interactions removes the most tedious parts of the event tracking process because:
- You don’t have to set up tracking on every element.
- You don’t need a third-party tool like Google Tag Manager.
- You don’t need help from a developer each time you want to analyze a new user action.
Instead, Smartlook collects the interaction data and all you need to do is select which interactions appear in your dashboard as events. The process by which you select these interactions is called defining an event.
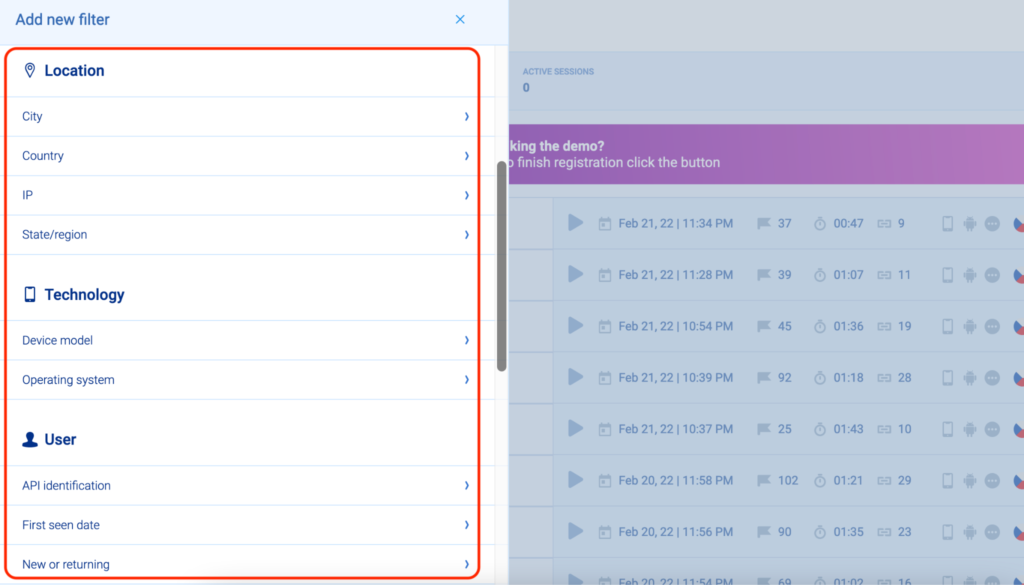
You can define events in three ways without coding:
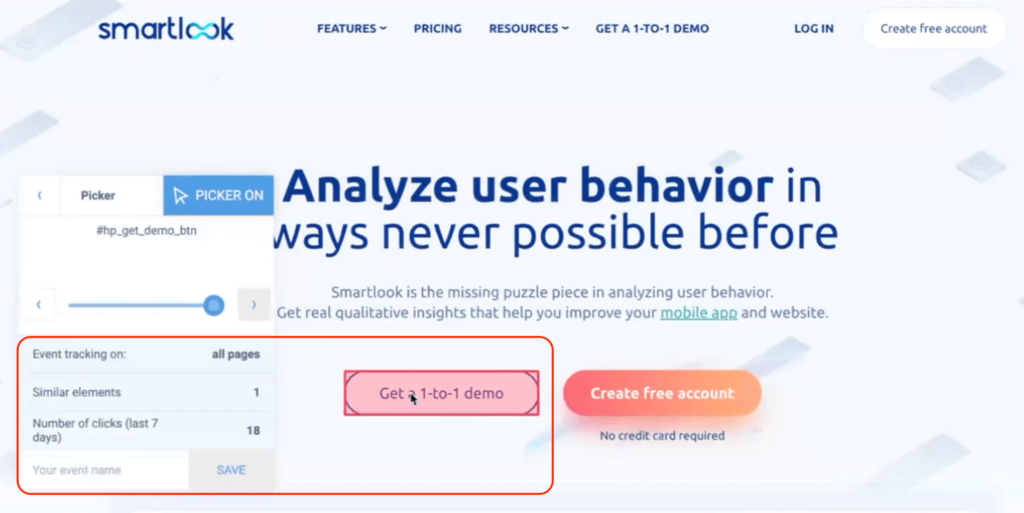
1. Use the no-code event picker. When defining a new Smartlook event, there’s a “Pick event on page” button, which lets you define an event by clicking on elements in your site or app’s UI, as shown in the screenshot below. Because the interaction data is already collected, you get information about the number of clicks on that element just by hovering over it.
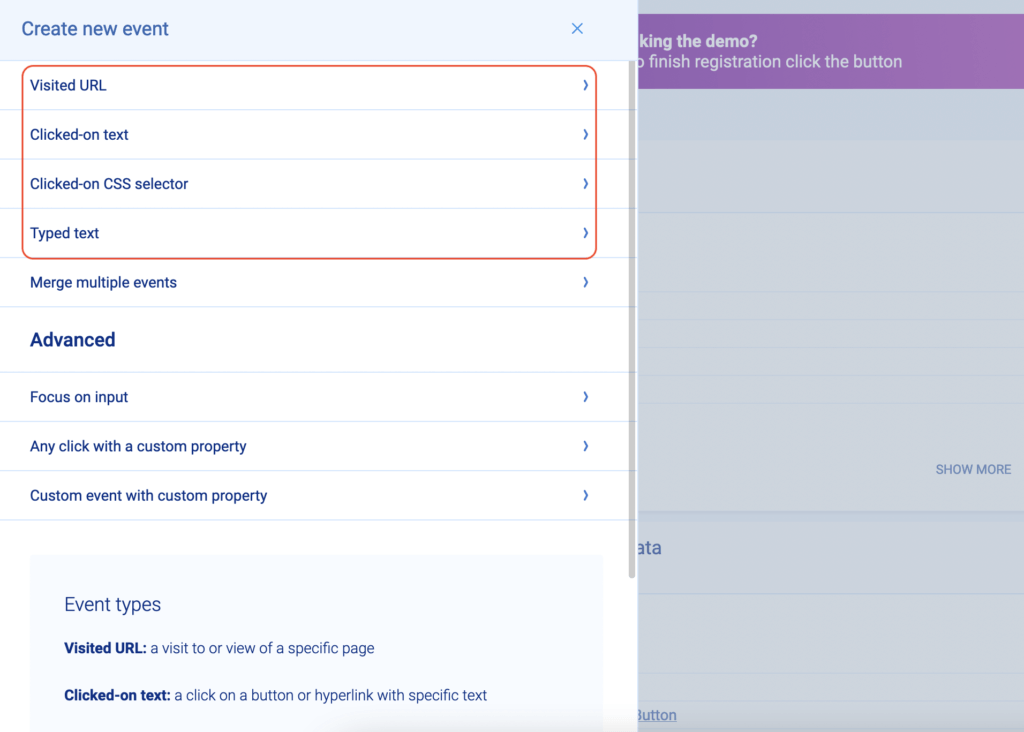
2. Choose from a template list of standard events, including clicked on URL, clicked on text, typed text, clicked-on CSS selector (allowing you to select any element on the page).
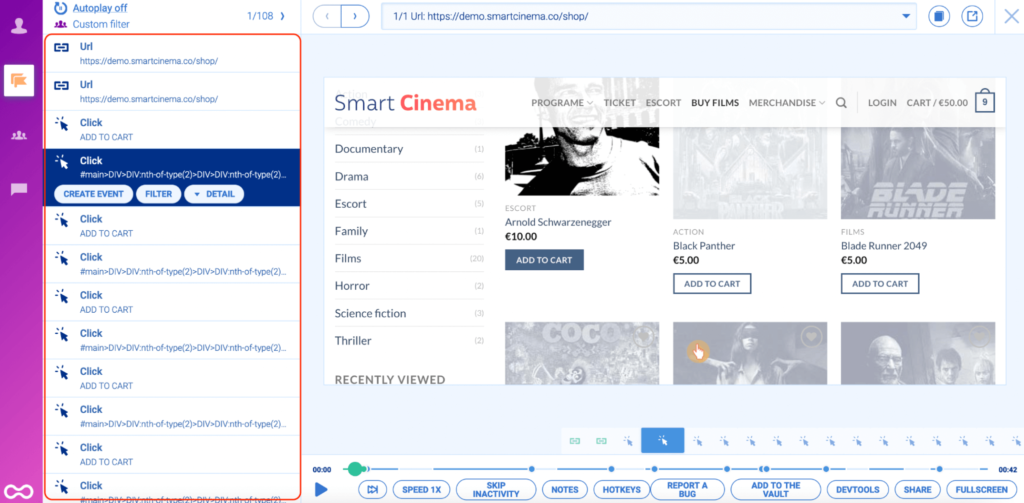
3. Define an event from a recording. While you’re watching a session recording you may see some actions that you’d like to track. In that case, you can pause the replay, click on the “Session events” tab, and make that action into an event without leaving the replay by clicking on “Create Event”.
You can also create custom events with JavaScript to track pretty much everything else outside of the standard events. For mobile apps, most events are typically custom.
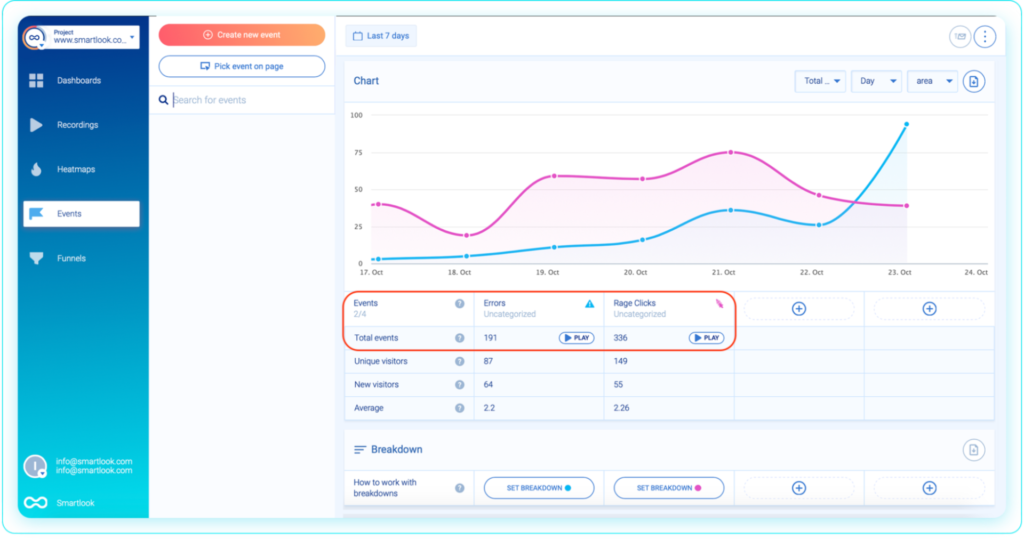
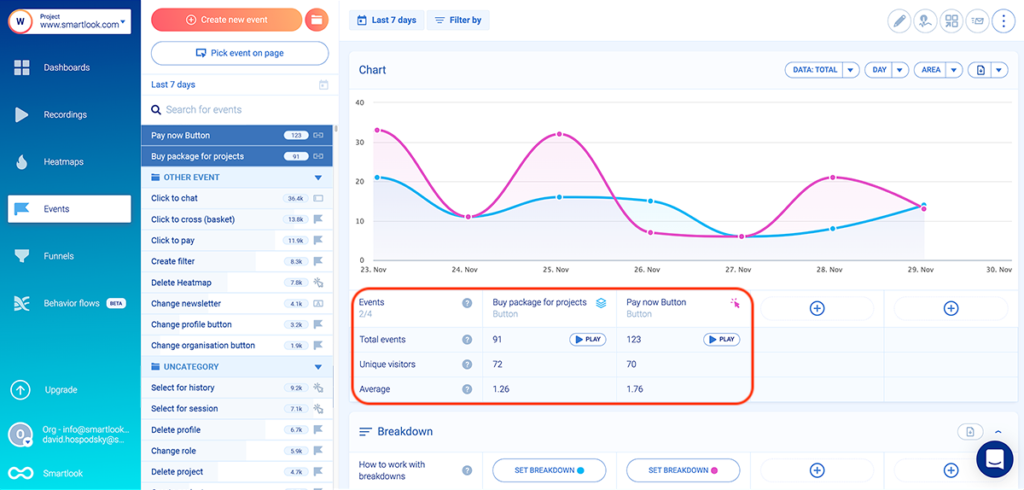
When you define an event, Smartlook immediately identifies every instance of that event, going back as far as your data retention plan goes. This allows the event tracking visualization to appear instantly (like in the GIF below).
An essential use case for event tracking is building funnels. Funnels are sequences of steps (i.e., events) users go through to complete a goal, like purchasing a product or completing an onboarding tutorial. Building funnels lets you analyze user behavior through these key flows, find out where users drop off, and calculate conversion rates.
In Smartlook, you can create a funnel by placing two or more events in the order you believe your users follow. Then, the funnel visualization appears instantly.
After that, you can see the funnel’s overall conversion rate, as well as the conversion rates and drop-offs between each step.
For example, an e-commerce store may want to track the user journey from landing on the homepage, through searching for an item and completing the purchase.
In Smartlook, you can build such a funnel with five events without coding:
- Event 1: A homepage visitor clicks on the shop (select the button with our no-code event picker).
- Event 2: The visitor searches for an item (use the “Typed text” event).
- Event 3: The visitor clicks “Add to cart” (select the button with our no-code event picker to define the event).
- Event 4: They click on the “Pay Now” button (again, select that button with the no-code event picker).
- Event 5: They land on the “Thank you” page (use the “Visited URL” standard event and enter the page URL).
You can see how event tracking and funnel analysis work in detail with Smartlook’s live public demo (no registration or credit card required).
#3 Combine session recordings with events and funnels for fast UX insights
While events and funnels are powerful tools, they only provide quantitative data. This means you can use them to find out what users do but not why they do it.
In fact, that’s one of the biggest problems with doing funnel analysis in GA. You can build all kinds of funnels (especially with GA4’s new funnel tool), but you’re in the dark when it comes to understanding the problems that lead to funnel drop-offs or how to fix them.
That’s why Smartlook combines the power of quantitative (events and funnels) and qualitative data (sessionrecordings) to help you quickly find opportunities for boosting your conversion rates.
When you open an event, there’s a “Play” button under the data visualization. Clicking it takes you directly to all session recordings where that event took place.
Besides quickly finding all sessions where an event took place, this functionality also shows you the full context behind specific user actions. For example, you can watch all sessions where users reached your site’s “Thank you” page after a successful purchase and see what they did before and after that.
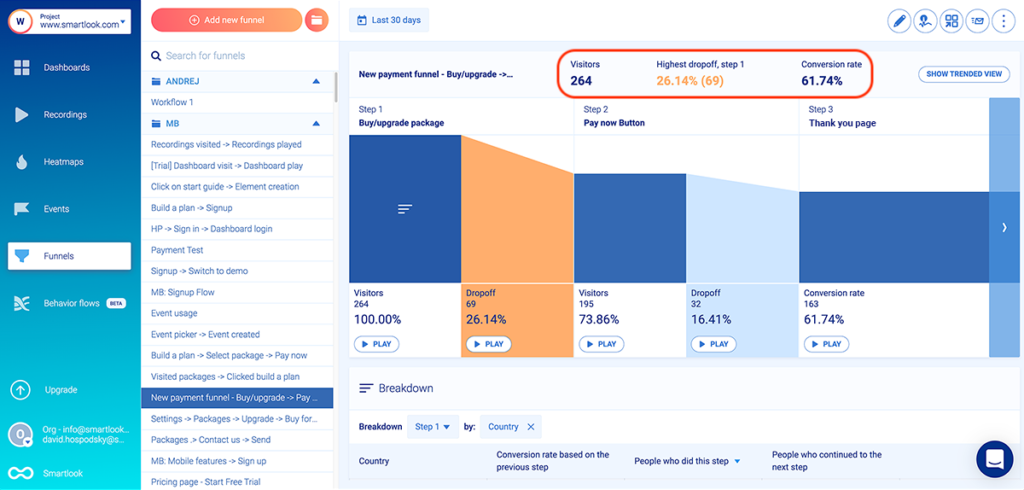
You can also combine funnel analysis with session recordings to see why users drop off.
For example, the screenshot below shows a three-step checkout funnel. As you can see under Step 2, 73.86% of all visitors who entered this funnel clicked on the “Pay now” button, yet only 61.74% of those same users landed on the “Thank you” page (Step 3).
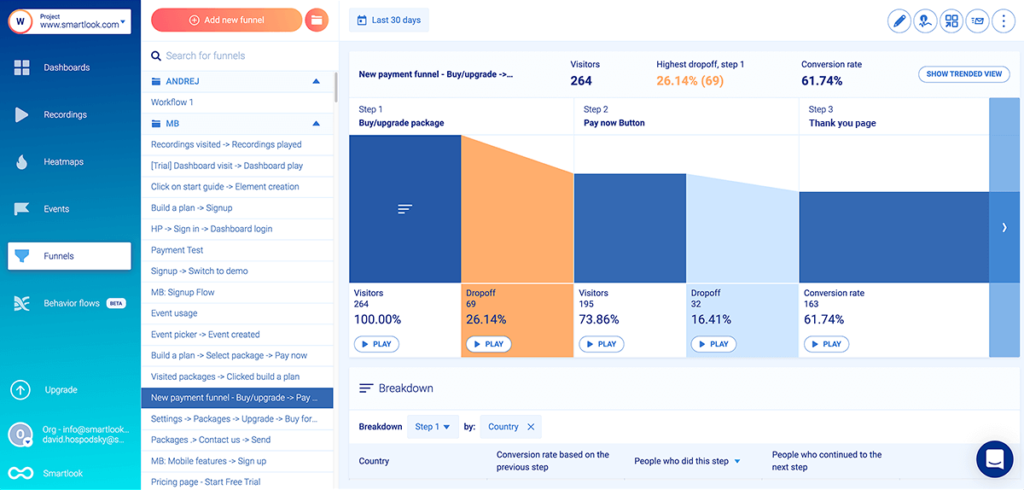
There’s an issue here since users who went through the checkout process and clicked on “Pay now” clearly want to buy. Now, if you built this funnel in GA, you’d have to start guessing what went wrong. However, with Smartlook you don’t need to guess, because you can instantly watch the session recordings of the users who dropped off between steps two and three.
As you can see, there’s a “Play” button under each step of the funnel, including the drop-off stages. Clicking that button under the drop-offs between steps two and three (or any other drop-off step) takes you to the session recordings of these 32 users, so you can find out why they dropped off.
This is the feature one of our clients used to discover that many users were abandoning their purchase funnel at the last step.
By combining funnel analysis with session recordings, they deduced that shipping prices were the biggest factor driving away customers. When they implemented changes based on their findings, orders increased by 161%, bringing in half a million dollars more in yearly revenue.
Smartlook Pricing
- Free Plan: Records up to 3,000 user sessions per month (no credit card required).
- Paid Plans: Start at $55/month (on our Pro plan), with a 30-day free trial. There are pre-made plans as well as an option for building custom plans.
Start analyzing and improving the experience of your website or mobile app’s users with Smartlook’s full-featured, 30-day trial today — no credit card required. If you need more time to evaluate, use our forever-free plan as long as you need.
2. Clicky
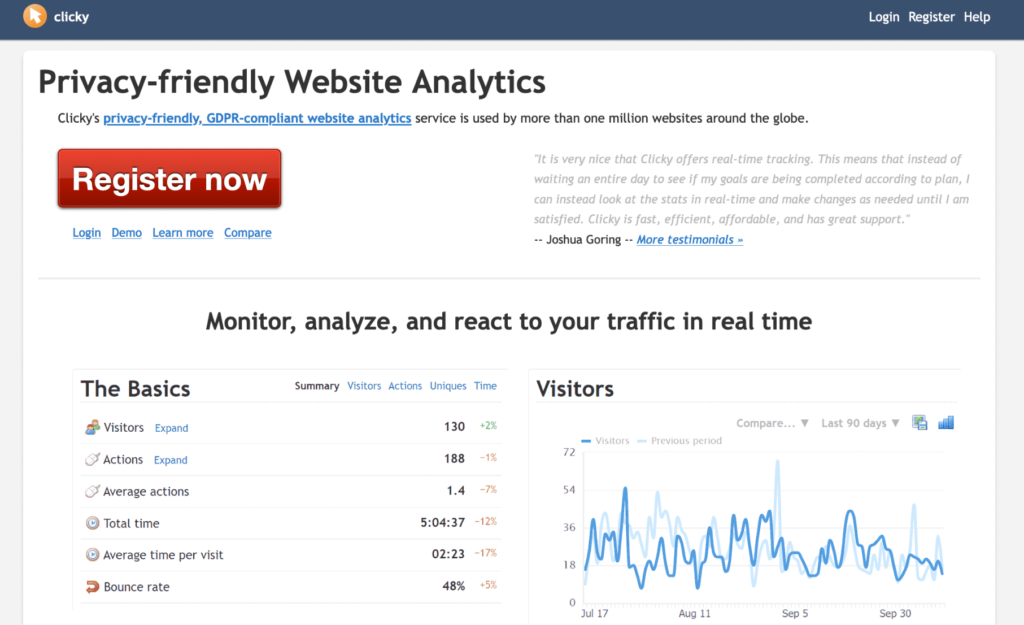
Clicky is a privacy-friendly web analytics software, which provides real-time analytics about your website’s traffic. Similar to GA, Clicky’s focus is on quantitative analytics, while also offering additional features like uptime monitoring and heatmaps.
Clicky Pricing
- Free Plan: Available for websites with up to 3000 daily pageviews.
- Paid Plans: Start at $9.99/month, depending on the number of websites you want to analyze and their daily pageviews.
3. Matomo (formerly Piwik)
Matomo advertises itself as a privacy-friendly web analytics platform that’s built to replace GA. As a result, it comes with similar quantitative analytics features as GA and Clicky. Matomo also provides a self-hosted free version, which is more difficult to set up and maintain but gives you complete data ownership.
Matomo Pricing
- Free Plan:Matomo has a free version (MatomoOn-Premise), which is self-hosted, meaning you need to set it up and maintain it on your own server.
- Paid Plans: There’s only one paid plan (€19/month), which comes with more advanced analytics features and is delivered as a SaaS tool.
4. Piwik PRO
Piwik PRO is an analytics solution for analyzing user journeys across websites and mobile apps. It offers standard quantitative analytics features, coupled with additional capabilities for coordinating tag behavior, building customer profiles, consent management, and more. Since Piwik PRO is a quantitative analytics tool, we offer an integration with it, which allows you to access your Smartlook session recordings directly from the Piwik PRO Analytics dashboard.
Piwik PRO Pricing
- Free Plan: Tracks up to 500,000 user actions per month.
- Paid Plans: Available upon request.
5. Woopra
Woopra is a quantitative analytics solution for tracking your customers’ journeys end-to-end. It’s more versatile than traditional analytics tools, as it comes with features for product, marketing, sales, and customer support teams.
Woopra Pricing
- Free Plan: Tracks up to 500,000 user actions per month.
- Paid Plans: Start at $349/month, with a 14-day free plan.
6. Mixpanel
Mixpanel is a product analytics tool, with features for analyzing conversions, app usage, and retention rate. It lets you build reports and custom analytics dashboards to analyze product adoption, conversion rates across different segments, and other important metrics. It’s another purely quantitative analytics tool, which is why we offer an integration with Mixpanel that allows you to see your visitors’ recording URLs in your event feed inside Mixpanel.
Mixpanel Pricing
- Free Plan: Includes up to 100,000 tracked users (unique visitors that performed at least one event).
- Paid Plans: Start at $25/month, with the option to build custom plans.
7. Heap
Heap is a digital insights platform that has both quantitative and qualitative analytics features. It offers a few different categories of tools for data analysis (e.g., reports and dashboards), data foundation (e.g., event tracking and enrichment), and data management (e.g., governance and security.) Although Heap was founded as a primarily quantitative analytics tool, with the recent acquisition of session recording and heatmapping provider Auryc, Heap now offers several qualitative analytics features.
Heap Pricing
- Free Plan: Records up to 10,000 monthly sessions for one website or product.
- Paid Plans: Start at $3600/year, with the option to build custom plans.
8. Fathom
Fathom is a website analytics tool with a big focus on privacy. It’s easy to use, as it’s only a single, user-friendly dashboard with quantitative stats and metrics about a site’s traffic (pageviews, referrers, user devices, bounce rate, etc.) Fathom also claims to bypass ad-blockers and that its embed code loads faster than GA’s, making it better for search engineoptimization (SEO).
Fathom Pricing
- Free Plan: No free plan, only a 7-day free trial.
- Paid Plans: Start at $14/month and scale depending on how many monthly pageviews your site generates.
9. Plausible
Similar to the previous entry, Plausible advertises itself as a privacy-friendly alternative to GA. Plausible is also an open-source solution (the code is available on GitHub), which doesn’t require cookie notices and is compliant with several key privacy laws like GDPR, CCPA, and PECR.
Plausible Pricing
- Free Plan: No free plan, only a 30-day free trial.
- Paid Plans: Start at $9/month and are customizable depending on how many pageviews your site generates each month.
10. FoxMetrics
FoxMetrics is a data analytics platform that lets users store and analyze behavior data from both web and mobile sources. Besides its standard quantitative analytics features, FoxMetrics stands out with its offering for restaurants, which lets restaurant owners collect analytics data from their website visitors, ordering systems, loyalty platforms, and other sources.
FoxMetrics Pricing
- Free Plan: No information about a free plan or trial.
- Paid Plans: Start at $399/month and scale depending on factors like how many events you want to track per month, user seats, the number of dashboards you want to build, and more.
11. GoSquared
GoSquared is a platform for engaging with your users and analyzing their behavior. It offers tools for marketing automation, live chat, web analytics, and more.
GoSquared Analytics Pricing
- Free Plan: No free plan, only a 7-day free trial.
- Paid Plans: Start at $9/month and scale depending on the number of sites you want to analyze and their monthly pageviews.
12. Kissmetrics
Kissmetrics is an analytics tool, specialized for SaaS and e-commerce businesses. It focuses on quantitative analytics, reporting on stats and metrics like new subscriptions, revenue, churn rate per customer segments, time to sign up, and more.
Kissmetrics Pricing
- Free Plan: No information about a free plan or trial.
- Paid Plans: Start at $299/month and scale depending on the monthly visitors, user seats, and domains tracked.
13. Adobe Analytics
Adobe Analytics is an enterprise analytics platform with a focus on quantitative analytics. The platform brings together a suite of tools that can help you capture and analyze real-time data from the entire customer journey. They have a huge focus on attribution and predictive analytics, which analyzes customers’ data and makes predictions about their future behavior.
Adobe Analytics Pricing
- Free Plan: No information about a free plan or trial.
- Paid Plans:Adobe Analytics’ price is available upon request.
Start tracking all user sessions and interactions on your site or app automatically with Smartlook
You can get a free 30-day, full-featured Smartlook trial (no credit card required) and start analyzing your users’ behavior with the help of session recordings, events, funnels, and heatmaps.
Our tool can be used on websites built with popular CMSs like WordPress, Joomla, and Shopify and also has integrations with popular A/B testing tools like Google Optimize and Optimizely.
Smartlook also has SDKs for 10 native mobile app platforms, frameworks, and engines — including iOS, Android, React Native, Flutter, Unity, and Unreal Engine. We have detailed documentation to guide you through mobile app implementation step-by-step. If you get stuck or have any questions at all, our Support team is ready and waiting.
For an in-depth Smartlook presentation that’s tailored to your business, schedule a demo with our team.