There are plenty of mobile app analytics best practices that teams swear by. The problem is that conventional advice tends to involve monitoring the wrong metrics or tracking the right KPIs but never mentioning how to use them to guide app development and optimization.
The result? You end up gathering data for the sake of supporting your hypotheses. Nothing more, nothing less. As David Ogilvy famously said, “Most people use analytics the way a drunk uses a lamppost – for support rather than illumination.”
To help you go beyond the surface-level advice regarding analytics for mobile apps, we’ve put together the following guide, which dives into everything wrong with the widely circulated advice, including what you should do instead.
You’ll leave with an in-depth understanding of how to gather data the right way, including which metrics to track and how to use your newfound insight to genuinely improve your app.
But before we get started, let’s begin by quickly recapping what mobile app analytics are and why it’s important to track them.
What are mobile app analytics?
Mobile app analytics are tools used to track and evaluate user behavior inside a mobile application.
They help you answer questions like how many people have downloaded your app? How are your users interacting with specific features? And where do folks get stuck and why?
Why are mobile app analytics important?
From helping you understand how people interact with your app to assisting in increasing download and user retention rates, there’s a lot that mobile analytics tracking offers.
Let’s break these benefits down:
- Understand your app’s performance. Mobile app analytics help evaluate how valuable your app is to users. Instead of reviewing broad indicators of app success, such as total downloads and Daily Active Users (DAUs), analytics go deeper, helping you create apps that stand out from the competition.
- Make informed business decisions across your organization. For example, product managers can use analytics-driven data to answer performance-related questions and, subsequently, improve user engagement, onboarding, and monetization metrics. Similarly, marketing teams can use the insights to create results-driving marketing campaigns, optimize ad spend, improve app store ranking, and more.
- Improve your mobile app’s performance by creating and optimizing features. Use analytics data to guide app development, including optimizing most-used features and user flows.
Mobile app analytics best practices: 8 proven tips (including mistakes to avoid as you track mobile analytics)
In this section, we’ll dig into 8 mobile analytics best practices, explaining how each practice is helpful and what most people get wrong.
Here’s a quick list of what we’ll cover:
- Track 3-4 primary metrics rather than attributing success or failure to one metric
- Obsess over UX-related metrics on top of revenue metrics
- Study cross-platform analytics instead of relying on mobile analytics alone
- Track different metrics for different teams, not one set of companywide metrics
- Make mobile analytics data accessible to all instead of closing it off to one team
- Ask why and dig deeper instead of digesting mobile metrics at face value
You can start using Smartlook on your mobile app or game today by signing up for a free account (no credit card required). Once our SDK is set up, Smartlook automatically starts capturing session recordings and user events, so you can analyze your app’s users and find ways to improve their experience.
1. Track 3-4 primary metrics rather than attributing success or failure to one metric
A common mistake that teams make is relying on a north star metric. Doing so severely limits perceptions of app performance, skewing reality altogether.
For example, if you review Daily Active Users (DAUs) alone, it’s impossible to know how long they’ve been using your app.
Joshua Wood, Founder and CEO of Bloc, shares another example — counting unique users.
“This can be misleading because it doesn’t take into account how often those users are opening the app. If someone opens an app once and then never opens it again, that’s counted as a unique user, when in reality that person isn’t really using the app.”
The solution? Track 3-5 metrics. But try not to go over five as tracking numerous app metrics can quickly become overwhelming.
Doist’s Head of Android, Rastislav Vaško, makes the same point.
Now the question is, which metrics should you be monitoring? “There isn’t a one-size-fits-all answer to this question, as the best way to monitor and study mobile app analytics will vary depending on the specific app and its goals,” Wood notes.
To get started, review your business goals. Are you looking to drive in-app purchases, or are you planning on improving user lifetime value? Select key performance indicators (KPIs) to track based on your goals.
Wood also shares his thoughts regarding which metrics to track: “Some tips for monitoring and studying mobile app analytics include tracking user engagement (e.g. how often users open and use the app), analyzing crash reports, looking at which features are used most often by users, and tracking conversion rates (e.g. the percentage of users who complete a desired action within the app).”
2. Obsess over UX-related metrics on top of revenue metrics
Another way to limit your perspective is by obsessing over tracking money metrics, such as how many in-app purchases were made, etc. This narrows your focus and doesn’t answer a key question: how useful do users find your features?
Intercom started its mobile app analytics journey on the same note. Like most SaaS companies, they focused on financial metrics like Monthly Recurring Revenue (MRR) and conversion rate (how many free users converted into paid users).
Over time, they realized the flaw in this approach and went on to track UX-related metrics on top of revenue metrics. This helped their team understand their app’s actual performance.
Nick Odlum, Analytics Manager at Intercom explains, “Without additional metrics focusing on user experience, the analytics team will miss out on crucial inputs to decisions the product team is making.”
Smartlook’s CTO, Ondra Machek, also favors studying UX-related analytics. However, Machek notes that it’s also common to focus heavily on crashes and Application Not Responding (ANR) metrics. “[But] while monitoring crashes is important, a crash-free app does not guarantee success,” Machek says.
Like Odlum, Machek also insists on monitoring in-app user behavior. “It is important to understand the user behavior and friction that people face and not only focus on outright technical problems.”
To make sure you’re arming your product team with the data they need, collaborate with them to identify helpful metrics. Don’t forget to regularly check on them to learn which data is helping them make better decisions.
3. Study cross-platform analytics instead of relying on mobile analytics alone
For some businesses, relying on mobile analytics alone can be misleading. This is especially true for eCommerce companies, where buyers often switch between mobile apps and websites throughout the purchasing process.
The solution? Cross-platform analytics. These give you the big picture when it comes to reviewing the customer journey in its entirety. In turn, this helps you identify where users get stuck, which elements or features drive conversions, etc.
This doesn’t mean you need to jump from tool to tool to map user behavior across your website, app, and other devices. A single, powerful analytics tool like Smartlook can help track user behavior across platforms, saving you from data silos and the struggle of constantly switching between tools.
With Smartlook, all you need to do is create a combined mobile and web project to monitor website and mobile app sessions with the same dashboard.
From here, Smartlook’s Identify API leverages a user’s identifying characteristics, such as their username or email, to track their sessions across platforms.
You can then analyze cross-platform behavior by doing the following:
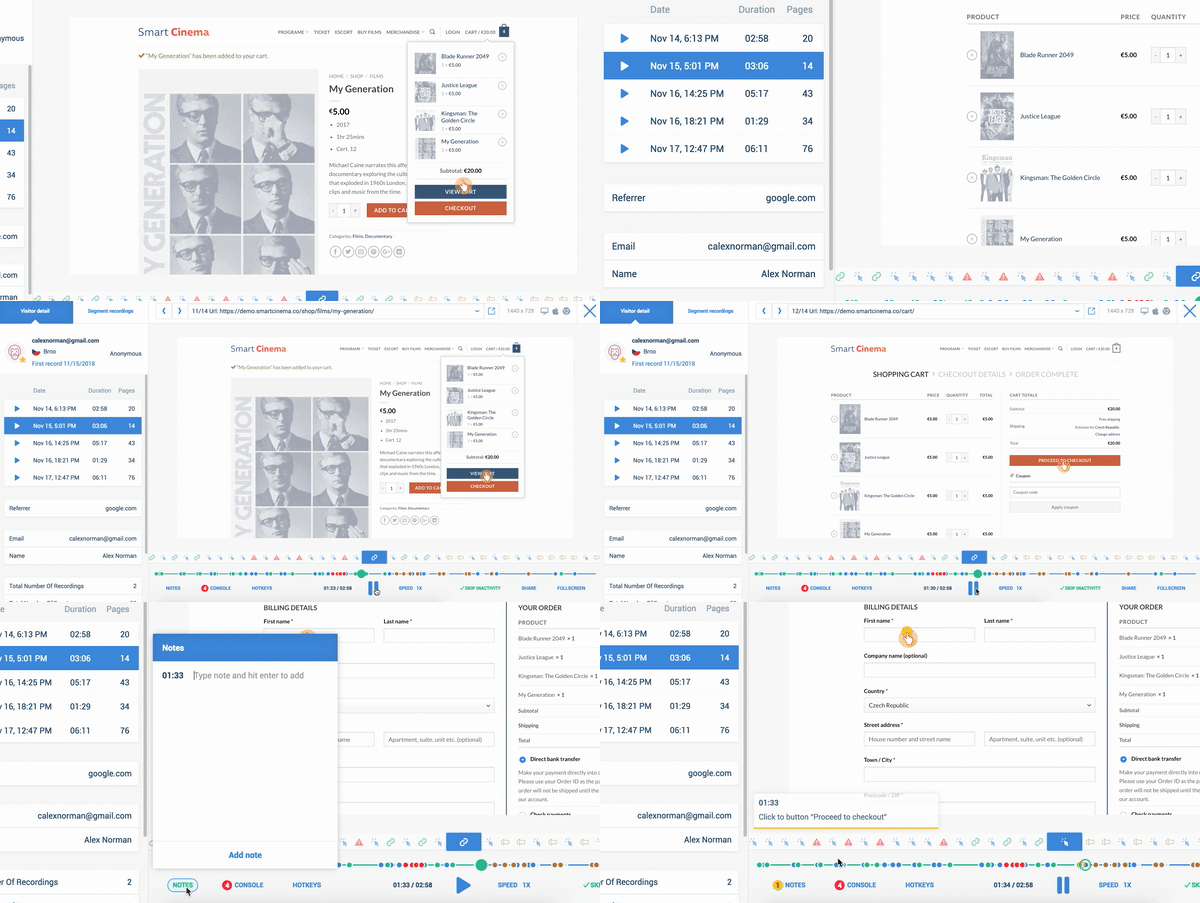
- Watching session recordings. These show you how users interact with your website and app: when they move from one platform to another, how long their sessions are, and what they’re interacting with.

- Using funnels to calculate conversion rates. These help you analyze the user journey across platforms so you can find out where users drop off and at which step in the funnel they’re converting.

4. Track different metrics for different teams, not one set of companywide metrics
Another misunderstood best practice regarding mobile app analytics involves tracking one set of metrics for everyone across an organization.
The question is, how can metrics that are relevant to the product team be useful to the marketing team? They really can’t be. And even though different teams are bound by a company mission, they all contribute to it differently. That’s why it’s essential to track a specific set of metrics for different teams — so you can empower them with the data that’s specifically useful to them.
Again, collaborating with teams on which metrics will be most relevant to them is key. Vaško recommends asking each team the following question: “What do you need to know?”
Once you have an answer, “only then think about what to measure to answer that question,” recommends Vaško. “Also, question your metric. If you’re, [for example], measuring clicks on buttons in a row, how much does the order influence the results?”
5. Make mobile analytics data accessible to all instead of closing it off to one team
Equally important to tracking different sets of team-specific metrics is making sure product analytics are accessible to all — whether they can read code or not.
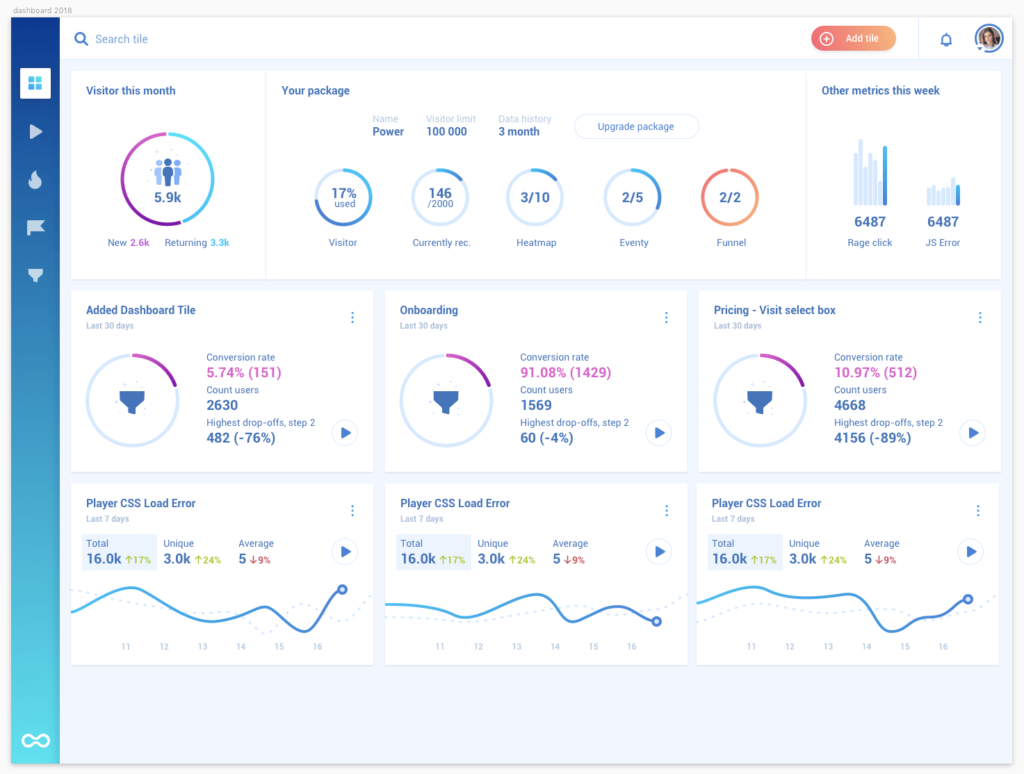
Fortunately, a mobile app analytics platform like Smartlook makes it easy to read data thanks to its visually engaging, readable dashboards.

Considering how important data accessibility is in today’s world, be sure to consider it as one of the leading factors when selecting a mobile app analytics tool. Even if your team is small, it’s best to plan ahead.
Luis A, Senior Product Designer at Doist, advises the following.
6. Ask why and dig deeper instead of digesting mobile metrics at face value
More prevailing advice regarding best practices for mobile analytics involves solely focusing on which key metrics to track. In reality, mobile app analytics is not only about monitoring metrics but rather about how to correctly use them to inform app development.
This brings us to human bias — often neglected in discussions about interpreting data, even though it significantly impacts them.
Psychological biases or logical fallacies refer to unconsciously looking for data that validates your presumptions. The result? A biased approach to tracking and monitoring app analytics. This is limiting as you only infer data to your benefit instead of letting it guide your decisions.
Educating yourself about possible biases that may impact your judgment is one way to protect yourself against them. Here are a handful of biases to be aware of:
- Confirmation bias. This is when you seek, interpret, or recall data to confirm your hypothesis or existing belief instead of considering alternative possibilities
- Narrative fallacy. Creating stories to explain data points without exploring what causes something in-depth. It also often leads to making causal inferences, which involves assuming something will happen again in the future because it happened in the past
- Backfire effect. This bias involves not believing or doubting the credibility of facts or data when they don’t align with your beliefs
- Bandwagon effect. This refers to believing or doing things just because others are doing it (for example, interpreting data in a way that others do)
An inquisitive mindset is another way to overcome potential bias. Always be sure to ask yourself “why” as you analyze data. This will keep you on your toes at all times.
7. Track behavioral data in addition to numerical data
Another common mistake that people make when setting up mobile analytics is only taking numerical data into consideration.
The truth is that numerical data is one-dimensional and often guides you in making biased decisions. Although it helps identify a problem, it rarely helps identify the root.
In contrast, pairing mobile app metrics analysis with behavioral data gives you a complete picture of what the problem is, what’s likely causing it, and how it impacts users.
Here’s how you can gather behavioral data:
- Regularly talk to your users
Dan Wolchonok, the Head of Data at Reforge, writes, “Talk to your existing high-intensity users and your infrequent users. They are a goldmine of information.”
Schedule one-on-one chats with users to understand which features they use the most, how they use them, what blockers they struggle with, and so on. Qualitative data like this saves you from bias-based decision-making.
- Watch user in-app interactions
Session recordings and heatmaps help with this. Session recordings are recorded episodes of user interaction within your app. Heatmaps, on the other hand, offer a visualization of how users interact with one screen. They show you how far users scroll, the buttons they click on, and the screens they swipe.
Heatmaps and session recordings help you understand user engagement, including which features they use the most, the most effective CTAs, points of friction, and more. Smartlook’s product marketing manager, Vojtěch Šibor, recommends watching session recordings to solve technical issues.
Despite their usefulness, our CTO, Ondra Machek, notes: “Even though it is 2022, the benefits of actually seeing the app in the hands of users are not widely known, and there is a lot of evangelization to be done. I wish more people know that session recording is not an arcane thing on the mobile side of things, and it is not that hard to implement.”
8. Always be mindful of consent when collecting mobile data
Lastly, when it comes to best practices regarding mobile analytics, consent to collect mobile user data such as email addresses, name and surname, location data, and more are often ignored, leading to legal scuffles.
As a result, businesses run the risk of losing user trust if they don’t respect user privacy. Be aware that different countries have different privacy laws — some stricter than others — making privacy-related matters even more confusing.
Remember that you always need mobile user consent whether you’re using Google Analytics or any other analytics platform to gather data. You’ll also need user permission if your app uses third-party cookies to share data with another third-party company.
The easiest solution to all of this? Use a privacy-friendly mobile app analytics tool. These tools can help you do the following:
- Obfuscate visual elements containing private information, such as password boxes
- Collect data via a wireframe mode that guarantees end users remain anonymous and masks sensitive fields in session recordings
- Store data in a safe cloud environment such as Amazon Web Services in the US and Europe
Lastly, a good analytics tool should only track user data across your apps and websites.
Smartlook is an analytics platform that can help with the above.
Mobile app analytics best practices in a nutshell
Mobile analytics help improve everything — from user experience to app marketing strategy. By tracking the right KPIs and continuously studying user behavior, you can even reduce the uninstall and churn rate.
The key to nailing analytics for mobile apps centers around the following foundational principles:
- Collaborate on what data to track (both qualitative and quantitative) for each team instead of picking and monitoring a handful of KPIs yourself
- Make data accessible using a mobile analytics tool that lays it out in an easy-to-understand manner
- Question all the data you gather. Ask ‘why’ so you don’t fall prey to common psychological biases
Most of all, make sure you use app analytics software that is compliant with user privacy laws.
Thankfully, Smartlook helps you track in-app and cross-platform behavior and analyze crash reports. It also makes data accessible to all teams — all within the boundaries of user privacy.
Using the quantitative and qualitative data you gather, you can easily improve your app’s UX, user retention rates, conversion rates, and average amount of revenue.
Upgrade your mobile app analysis with Smartlook
Smartlook can be used on all kinds of native iOS and Android mobile apps, that are built with various frameworks and engines — including React Native, Cordova, Flutter, Ionic, Unity, and more. We have detailed documentation to guide you through the implementation, but if you need any assistance, our Support team is ready and waiting.
Schedule a Smartlook demo or start your free, full-featured 30-day trial today.


