As a product manager, your day-to-day probably includes many different responsibilities, like:
- Analyzing how users interact with your product
- Working on the product strategy and roadmap
- Maintaining the product backlog
- Getting direct feedback from users
- Collaborating with other teams, and more
To help you with these tasks, this guide contains the top 18 product manager tools, organized into six categories:
- Product analytics tools: Smartlook, Amplitude, and Google Analytics
- Product roadmapping and development tools: ProductPlan, Productboard, and Aha!
- Project management tools: Trello, Asana, and Jira
- User feedback tools: Typeform, SurveyMonkey, and Survicate
- Collaboration and messaging tools: Slack, Microsoft Teams, and Confluence
- Tools for generating and sharing product ideas: Figma, Dropbox, and Google Drive
Smartlook lets product managers capture everything users do while navigating their product, analyze why they do it, and improve their UX, conversions, and retention. Book a free demo with our team to see how Smartlook can help you build better products or start a full-featured, 30-day trial (no credit card required).
Product analytics tools
These tools help you analyze your user’s behavior and find ways to improve their experience. They do this through various quantitative and qualitative analytics features, like session recordings, event tracking, funnel analysis, retention analysis, and more.
1. Smartlook

- Pricing: Smartlook has a free plan that captures up to 3,000 user sessions/month. Paid plans start at $55/month and come with a full-featured, 30-day free trial (no credit card required).
Smartlook is our combined product analytics and visual user insights platform that brings together quantitative and qualitative analytics features, such as:
- Session recordings, which show you exactly how users interact with your product, from the moment they open it to the moment they close it. This makes them invaluable for empathizing with users, understanding why they do what they do, bug fixing, and much more. You can use more than 30 filters to find session recordings representing specific user segments, so you don’t have to spend hours watching sessions to find useful insights.

- Heatmaps, which provide an overview of a typical user’s behavior on a page or screen. They’re easy to create and interpret, while providing useful behavior insights, such as where users click (or tap), how far they scroll, and where they move their mouse.

- Events, which allow you to track individual user actions (like button clicks or text inputs) and monitor their occurrence over time. Unlike most product analytics tools, Smartlook automatically tracks all user interactions, so you don’t have to wait for your development team to manually set up tracking for each event. Additionally, you can use events to find the exact session recordings of users who perform specific behaviors — another huge time saving feature.

- Funnels, which help you analyze and optimize the conversion rates for user flows, like onboarding tutorials and checkouts. By building funnels, product managers can understand how users navigate important flows, calculate their conversion rates, and find friction in the user journey.

- Retention tables, which allow you to track how user cohorts behave over time. Product managers can use retention tables to learn what percentage of the users who perform an action for the first time continue to do so again. For example, retention tables can show you what percentage of the users who log into their account for the first time do so again over the next few days, which is crucial for determining your onboarding’s effectiveness.

Here’s an example of how product managers can use some of these features in their day-to-day life.
Record your users’ actual experience and keep track of important product metrics
Smartlook is built to capture both qualitative and quantitative product usage data.
For example, the screenshot below shows a Smartlook session recording of a user trying to complete a checkout process.

As you can see, this isn’t a text-based representation of a user’s session, like many product analytics tools provide. It’s an exact rendering of your product’s user interface and every interaction the user has with it.
The session replay (containing qualitative insights) and the additional quantitative details captured by Smartlook equip product managers with lots of useful insights, including:
- The reason for the unsuccessful checkout, e.g., the user submitted an invalid credit card
- A timeline of all actions, or events, the user performed during the session (under the session replay)
- Their device, operating system, and location (to the left of the session replay)
- All recorded sessions for this user, as well as their time and date
Product managers can use these insights to analyze what their users do and uncover why they do it, which helps them find ways to improve the user experience, boost conversions, and increase retention.
Plus, session recordings are a powerful tool for other teams in the organization, including marketing, customer success, development, and quality assurance (QA) — a point we explain in detail in our product analytics guide.
Lastly, product managers can use the Smartlook dashboard to monitor metrics and other quantitative data points at a glance, as shown in the screenshot below.

Smartlook dashboards are completely customizable, so you can add new tiles with useful information for your product team, like daily active users, retention rates, in-app purchase events, and much more.
3 other reasons why product managers love Smartlook
- Extremely simple setup and fast insights. Smartlook starts recording every user session in your product with only one code snippet. As a result, you can watch session recordings, create heatmaps, track events, and build funnels — all within minutes of setting up Smartlook.
- The ability to combine quantitative data with qualitative product experience insights. With Smartlook, you can use quantitative data to hone in on problem areas and qualitative data to find their root cause. For example, the screenshot below shows a checkout funnel, in which 16.41% of users drop off between clicking on “Pay now” and landing on the “Thank you” page. The small “Play” button under this step takes you directly to all session recordings of users who dropped off, so you can find out why, without sifting through all other session replays.

- The Identify API, which helps customer support, dev, and QA teams fix bugs faster. Oftentimes, bugs reported by users are difficult to understand and fix, due to users’ explanations being inaccurate. When our Identify API is set up, you don’t have to rely on users’ explanations, because you can jump straight into the recordings of their sessions using an identifier, like an email or username. This makes understanding the problem much easier for customer support teams, while also speeding up bug fixing because dev and QA teams don’t have to reproduce bugs via trial and error.

Start a full-featured 30-day trial of Smartlook today (no credit card required) to try all of these capabilities yourself or book a free demo with our team.
2. Amplitude

- Pricing: Free plan is available for up to 10 million monthly events and basic analytics features. There are no publicly available pricing plans, but the lowest price that Amplitude customers report is around $5,000/year.
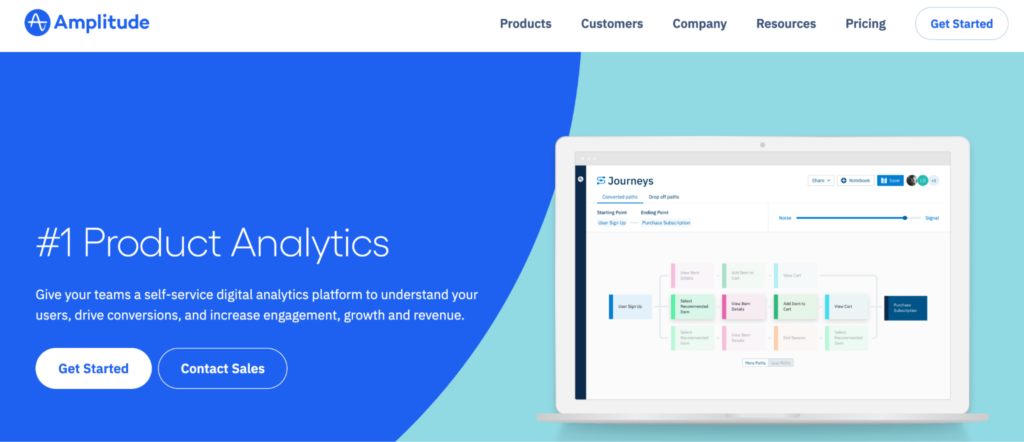
Amplitude is a product analytics platform that combines a few different products, like Amplitude Analytics (for analyzing user behavior), Amplitude Experiment (for running A/B tests and other experiments), and more.
It’s one of the most seasoned product analytics solutions on the market, giving product teams lots of options for performing event-based analytics and analyzing quantitative user data.
Two downsides to this tool are its steep learning curve and lack of qualitative analytics features. If you’re interested, check out our detailed comparison of Smartlook, Amplitude, and Mixpanel (another popular product analytics tool) where we discuss their differences and overlapping features.
3. Google Analytics

- Pricing: Google Analytics is free.
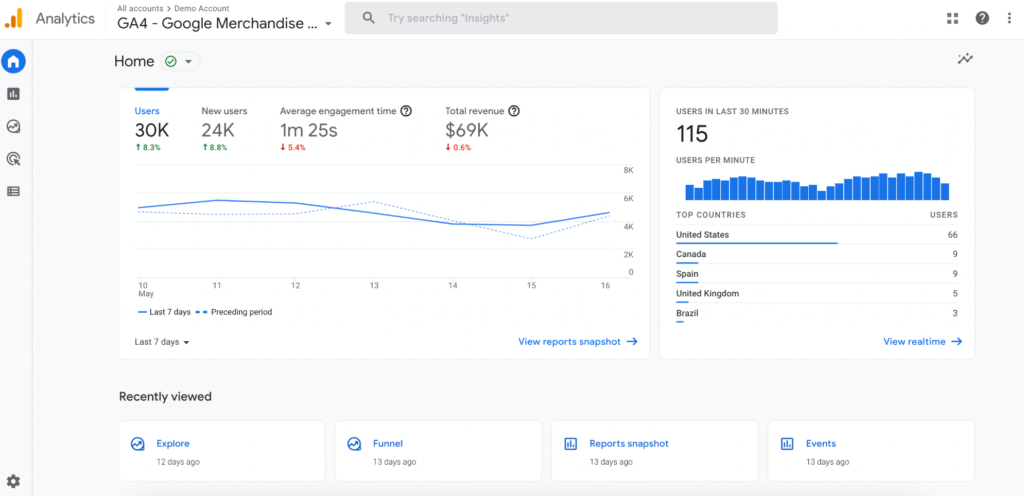
Google Analytics is the category-defining analytics tool. It’s by far the most popular analytics solution, as it’s free and highly customizable while offering tons of analytics features for both beginners and advanced users.
Like Amplitude, Google Analytics also doesn’t have qualitative analytics capabilities — a problem we’ve discussed in our article on the top 13 Google Analytics alternatives.
Product roadmapping and development tools
The tools in this category help product teams visualize their product strategy, prioritize ideas, build a roadmap, and execute it.
4. ProductPlan

- Pricing: Starts at $49 per roadmap editor/month, with a free trial and standard features. More expensive plans come with premium features, such as additional integrations and a designated customer success manager.
ProductPlan is a roadmapping tool that lets you visualize your product strategy, streamline your workflows, and create launch plans. It’s also useful for prioritizing different initiatives and getting team members aligned on the product vision. Lastly, ProductPlan offers various roadmap templates, which you can customize with a drag-and-drop interface, color-coding capabilities, and much more.
5. Productboard

- Pricing: Starts at $25 per maker (user with full access) per month. Each plan starts with a 15-day free trial that doesn’t require a credit card.
Like ProductPlan, Productboard lets you build interactive roadmaps that help align everyone and prioritize product initiatives. It also has features for centralizing user feedback from various sources, like Zendesk, Gong, and Slack, in one place.
6. Aha!

- Pricing: Differs depending on the Aha! product you want to use. The roadmapping software starts at $59 per user/month, while the product development tool starts at $9 per user/month.
Aha! is a product management software that combines a few different tools:
- Aha! Roadmaps, which lets you set a product strategy, visualize it, and prioritize features.
- Aha! Ideas, which centralizes user feedback from different sources.
- Aha! Create, which helps you organize information in a digital notebook.
- Aha! Develop, which allows you to empower your development teams by creating an integrated product management and development workflow.
Project management tools
These tools allow you to create tasks and assign them, set deadlines, track if everything’s moving according to schedule, and review your team’s performance.
7. Trello

- Pricing: There’s afree plan with unlimited cards, 10 boards per workspace, and unlimited storage. Paid plans start at $6 per user/month and include more workspace commands, advanced admin and security capabilities, and other premium features.
Trello is one of the most popular project and task management tools out there. It’s a simple Kanban-style tool, meaning it lets you visualize your workflow and break it down into boards, lists, and cards. It also supports different views, such as Tables, Calendars, Timelines, and more.
8. Asana

- Pricing: Asana has a free plan that lets you collaborate with up to 15 teammates. Paid plans start at $10.99 per user/month and bring additional features like a workflow builder, forms, custom fields, and more.
Asana is a work management tool that helps teams stay organized and connected through each stage of the product lifecycle. It lets you create tasks, set deadlines, assign work to different contributors, and track your progress. It also has different views, depending on how you’d like to visualize your work — in a list, as a timeline, or in a board.
9. Jira

- Pricing: Jira has a free plan with basic features for up to 10 users. Paid plans start at $7.75 per user/month with more features like advanced roles and permissions.
Jira is a project management tool and software development for agile and scrum teams, owned by the company behind Trello and Asana — Atlassian. The main difference between these tools is that Jira has specialized features that help software engineers create user stories, plan sprints, fix bugs, and build new product features. Jira and Asana can also be connected in order to improve cross-team collaboration.
User feedback tools
With these tools, you can get direct feedback from your users on how they feel about your product through surveys, forms, in-product feedback widgets, and more.
10. Typeform

- Pricing: There’s a free plan that you can use without a time limit. Paid plans start at $29/month for 1 user and 100 monthly responses to forms and surveys.
Typeform is a tool for creating online forms and surveys. One of its distinguishing characteristics is that it presents users with only one question at a time, which mimics real conversations and produces higher response rates. It also comes with a built-in photo and video library to make your forms and surveys more engaging.
11. SurveyMonkey

- Pricing: There’s a free plan that you can use, alongside different paid plans for individuals and teams. Individual plans start at $39/month when billed annually and $99/month when billed monthly. Team plans start at $25 per user/month.
SurveyMonkey is one of the most popular online survey tools on the market. It lets you easily create surveys, polls, and quizzes and gather feedback in various ways — via social media, email, mobile chat, etc. You can also choose from different themes and tailor the survey layout to your needs.
12. Survicate

- Pricing: The free plan lets you run surveys and collect unlimited responses for up to 7 days. Paid plans start at $53/month for capturing feedback from 250 customers per month, plus custom survey design, chart exports, and other advanced features.
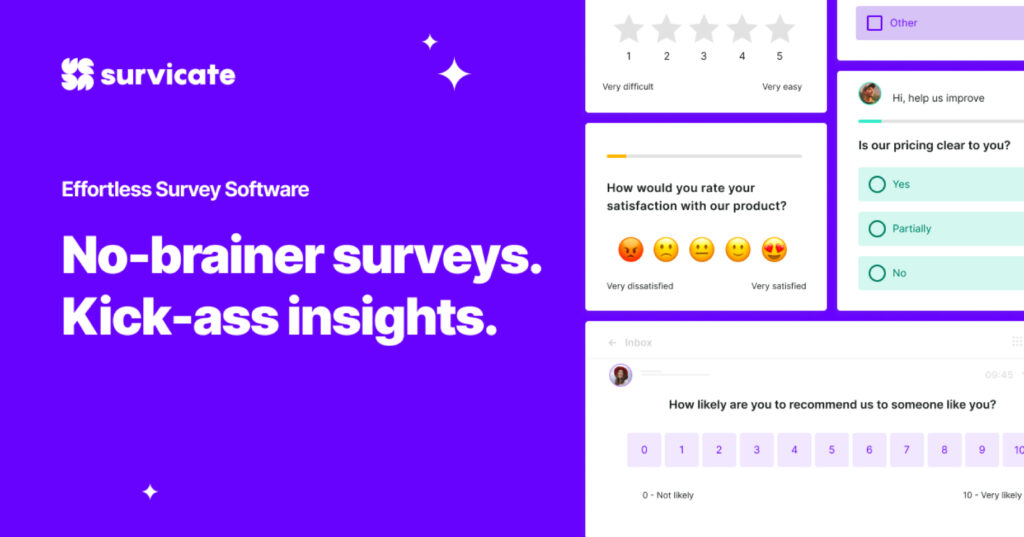
Survicate is an effortless survey tool that allows you to collect continuous customer feedback via email, web, in-product, and mobile apps. Besides making it easy to create different types of surveys (including NPS and CES), Survicate also lets you customize how they look. Additionally, Survicate’s Feedback Hub lets you track customer feedback from multiple sources — like Intercom, Slack, and Gmail — in one place.
Note: You can integrate Survicate with Smartlook and connect survey responses to session recordings. For example, when users give negative responses to a question like “How would you rate your experience with our product?”, you can jump straight into their session recording to try and find out what went wrong.
Collaboration and messaging tools
The tools in this category have become a must for pretty much every product team, thanks to their chart, video conferencing, and knowledge base organization capabilities.
13. Slack

- Pricing: Slack’s free plan lets you use the app, but gives you access to only 90 days of message history. Paid plans start at $8.75 per user/month, with unlimited message history, more integrations, and additional functionalities.
Slack is one of the startups that revolutionized team communication a few years back. The Slack app supports real-time communication with live chat, video conferencing, and huddles. While it started as an in-company chat tool, many organizations today use it for different purposes, such as collecting user feedback, providing support to customers, and building online communities.
14. Microsoft Teams

- Pricing: The free plan lets you run unlimited one-on-one meetings for up to 30 hours each month and have unlimited group meetings for up to 60 minutes. Paid plans start at $4 per user/month and have extended meeting time, additional cloud storage, and other advanced features.
Like Slack, Microsoft Teams has live chat, video conferencing features, and other collaboration features. As a Microsoft product, Teams plays well with other tools in the Microsoft stack, like Word, PowerPoint, Excel, and Forms. For example, you can use Forms to add polls and surveys to a Teams channel or chat.
15. Confluence

- Pricing: Confluence has a free plan for up to 10 users. Paid plans start at $5.75 per user/month and come with more features, such as granular permissions, team calendars, and data residency.
Confluence, also owned by Atlassian, is a team workspace that lets you share knowledge and collaborate with colleagues and stakeholders. It’s a different type of collaboration tool from the others in this category since it doesn’t offer chat or video conferencing. Instead, it focuses on helping teams create a single source of truth for ideas and communicate on different projects.
Tools for generating and sharing product ideas
The first tool in this final category (Figma) lets you create and collaborate on designs, wireframes, and prototypes, while the latter two (Google Drive and Dropbox) provide an easy way to share your ideas with others.
16. Figma

- Pricing: Figma’s free plan lets you work on three Figma and three FigJam files. The pricing for the design and prototyping product starts at $12 per editor/month. The pricing for the whiteboarding product (FigJam) starts at $3 per editor/month.
While traditionally part of a designer’s toolkit, many product managers use Figma also, thanks to its simple and powerful design and prototyping capabilities. It’s easy to use, so you can quickly throw together rough sketches and discuss them with UX designers (or comment on their designs, wireframes, and prototypes). Plus, FigJam — the online whiteboard — is great for real-time ideation and brainstorming.
17. Google Drive

- Pricing: Google Drive’s free plan lets you store 15 GB of files per user. The paid plan is $12 per user/month for up to 2TB of storage. It’s worth noting that the $12 price tag includes premium features for all other Google Workspace products, like Docs, Sheets, Slides, etc.
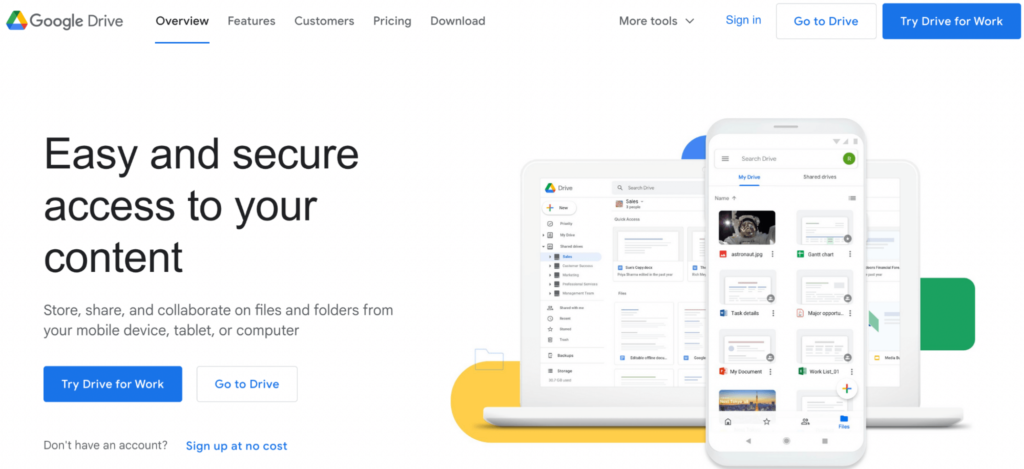
Google Drive is a cloud-based file storage and synchronization tool. It’s one of the most widely-used products for storing files, as it has an extremely generous free tier and is part of the larger Google Workspace suite, which tons of organizations use.
18. Dropbox

- Pricing: Dropbox lets you store up to 2GB of files for free. Paid plans scale depending on your users and storage needs, with the lowest plan starting at $11.99/month for 2TB of storage and 1 user.
Dropbox is very similar to Google Drive in the sense that it also lets you store files and share them with others. While more expensive, Dropbox has certain advantages, such as its faster sync times, better file-sharing permissions, and more file recovery capabilities. If you’re interested, this blog post by Zapier offers an excellent comparison between Dropbox and Google Drive.
Improve your product’s user experience, conversions, and retention with Smartlook
Smartlook is the only combined product analytics and visual user insights platform that won’t take your team forever to set up. You can use it to gather user behavior data with minimal to no intervention from your team.
You can see Smartlook in action without spending any time registering or setting it up. Just book a free demo using this form and our team will give you a detailed Smartlook presentation that’s tailored to your business. Customers leave positive feedback about our demos 99% of the time, so you’re bound to learn something useful from our team.
Lastly, you can also give Smartlook a go yourself by signing up for a full-featured, 30-day trial of Smartlook today (no credit card required).


