Tracking website visitors can give you valuable insights into:
- How visitors interact with your site, e.g., the buttons they click, the web pages they visit, and the flows they go through.
- Key stats and metrics about your site’s traffic, like pageviews, bounce rates, traffic sources, and audience demographics.
- The companies visiting your site and their behavior.
Depending on the information you need, there are different types of website visitor tracking software that can help you out. In this article, we’ll review nine of these tools, with a focus on their features, use cases, and pricing.
To help you find the right one for your needs (and understand the differences between each type of web visitor tracking), we’ve split them into three categories:
- 3 tools for tracking user behavior on your website. These tools come with behavior analysis features like heatmaps and session recordings that show you what visitors do on your site. This helps you understand your users’ behavior, so you can improve their experience, boost your conversion rates, fix bugs, and more. These tools are really versatile, as they can be used by marketing, product, user experience (UX), customer support, development, and quality assurance (QA) teams.
- 3 traditional website analytics tools. These tools provide aggregated quantitative data (i.e., stats and metrics) about your site’s traffic. This data helps you analyze your site’s audience, such as which channels lead them to your site, which countries they’re from, how long they stay on landing pages, and more. They’re mostly used by marketing and product teams to analyze marketing campaigns, feature usage, user cohorts, and more.
- 3 tools for website visitor identification. These tools show you which companies are visiting your site. This information can be super useful for B2B businesses in helping them understand which prospects to focus on. Visitor identification tools are used primarily by marketing and sales teams to optimize their lead generation efforts.
If you want to start analyzing user behavior on your website today, sign up for a full-featured 30-day trial of Smartlook (no credit card required). Our web and mobile visitor tracking platform can help you understand and improve your users’ experience with the help of session recordings, heatmaps, event tracking, and funnel analysis.
3 tools for tracking user behavior on your website
The tools in this category help you analyze how users interact with your site — which buttons they click, which pages they visit, where they drop-off, and much more.
Behavior tracking can give you a nuanced and detailed view of the entire customer journey, which is paramount for improving your site’s UX and conversion rates.
All three tools below have a simple setup, as they require you to install just one code snippet on your site. Once that’s done, they automatically start collecting user behavior data.
In terms of features, the best behavior tracking tools come with a mix of quantitative and qualitative analytics capabilities, including but not limited to session recordings, heatmaps, event tracking, and funnels.
This feature set makes these tools really versatile, as they can serve marketing, product, UX, customer support, dev, and QA teams in their day-to-day tasks.
1. Smartlook
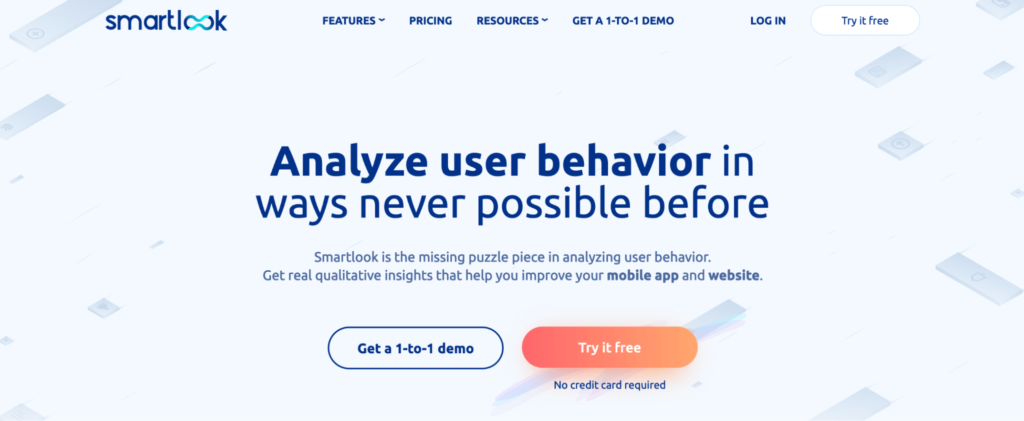
Smartlook is our platform for analyzing user behavior on websites and mobile apps. It combines four key qualitative and quantitative analytics features:
- Heatmaps, which show you where users click, scroll, and move their cursors
- Session recordings, which show you individual visitors’ entire experience across your site, from the moment they open it to the moment they close
- Event tracking, which lets you track user actions like button clicks, URL visits, and text inputs
- Funnel analysis, which lets you monitor users’ journey through key flows, calculate conversion rates, and find drop-offs
This mix of quantitative and qualitative analytics features shows you everything your website’s visitors do. More importantly, it helps you uncover why they do it, so you can improve their experience and your conversion rates.
In the next sections, you’ll learn how to get useful behavior insights with these four features.
Heatmaps: Get an overview of how users interact with key pages
Heatmaps are a great starting point for analyzing visitors’ behavior.
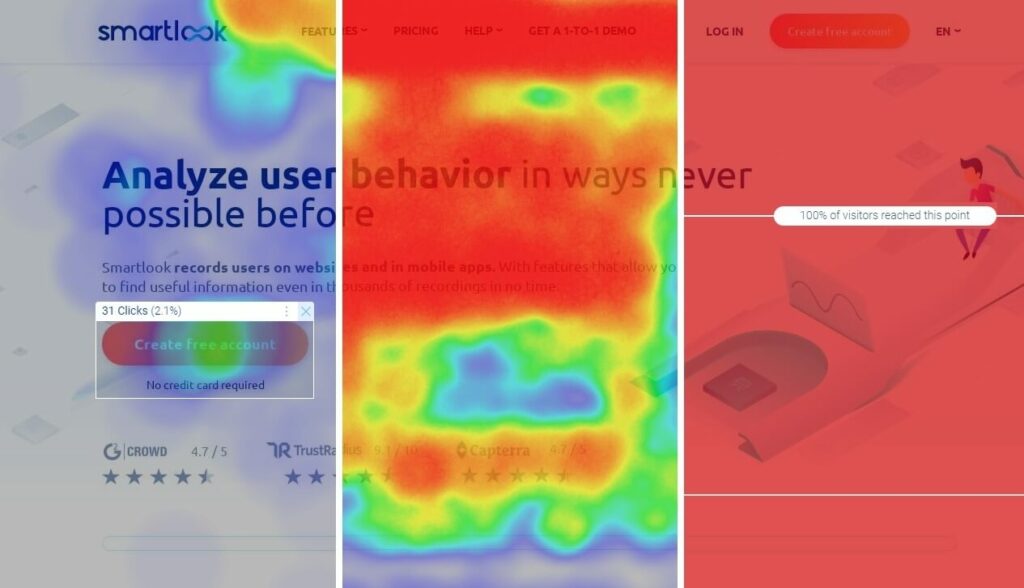
They’re super easy to create and read, while also providing valuable insights. Smartlook has three types of heatmaps — click maps (left in the screenshot above), move maps (middle), and scroll maps (right).
- Click maps show you where users click. Use them to find which elements users interact with the most.
- Move maps show you where users move their cursors. Use them to determine which elements draw users’ attention.
- Scroll maps show you what percentage of users scroll to each part of a page. Use them to see what percentage of visitors reach important page elements, so you can make informed decisions about their placement on the page.
For example, heatmaps showed Sewio that many of their website’s visitors weren’t reaching and interacting with key call-to-action (CTA) buttons. With this insight, they reworked their homepage, increasing the clickthrough rate (CTR) of their “Go to store” button by 276% and tripling clicks to their customer success stories.
Session recordings: Watch users’ entire experience on your site
Session recordings (sometimes called session replays) show you users’ entire experience with your site, from the moment they open it, to the moment they close it.
This means you get to see the full context behind their actions, which helps you understand why they do what they do.
For example, the screenshot below shows a session recording of a user trying to complete a checkout process.
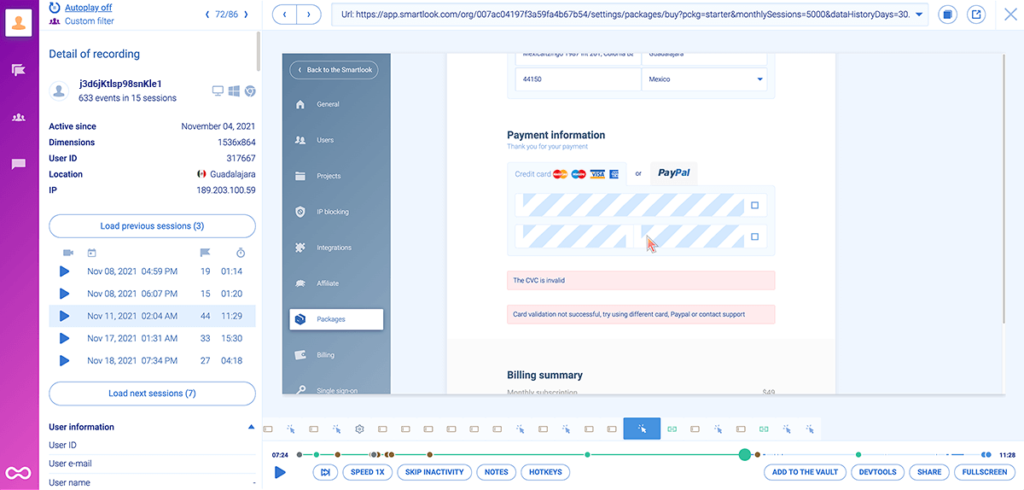
There’s lots of useful information here, including:
- The reason for the unsuccessful checkout, i.e., the user submitted an invalid credit card
- A timeline of all actions the user performed during the session (under the session replay)
- Their device, operating system, and location (to the left of the session replay)
- All recorded sessions for this user, as well as their time and date
Smartlook is designed to limit the collection of personal or sensitive data by default, and Smartlook does not record sensitive data, including credit card information. You can even mask or exclude additional elements from being captured.
Once our code snippet is installed, Smartlook starts recording all user sessions on your site, meaning you don’t have to manually start and stop the session recorder.
For websites with a healthy amount of daily traffic, you’ll start getting session recordings a few minutes after the code snippet’s been installed.
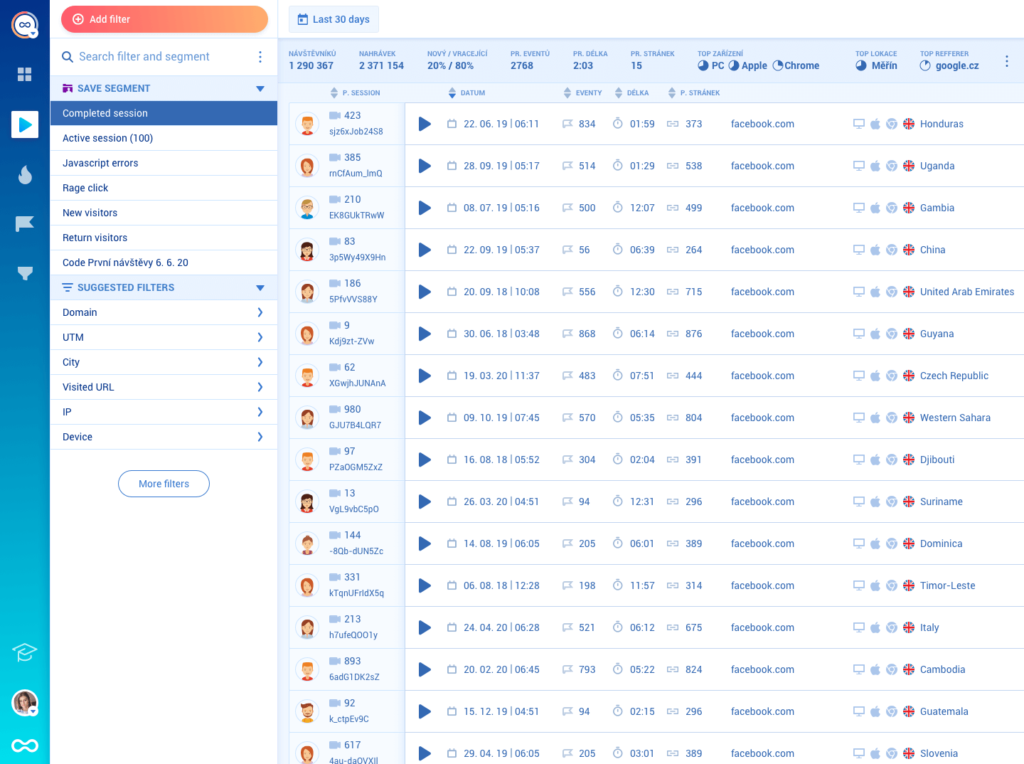
To help you find relevant session recordings faster, Smartlook also has 30+ filters, like device, operating system, country, and more.
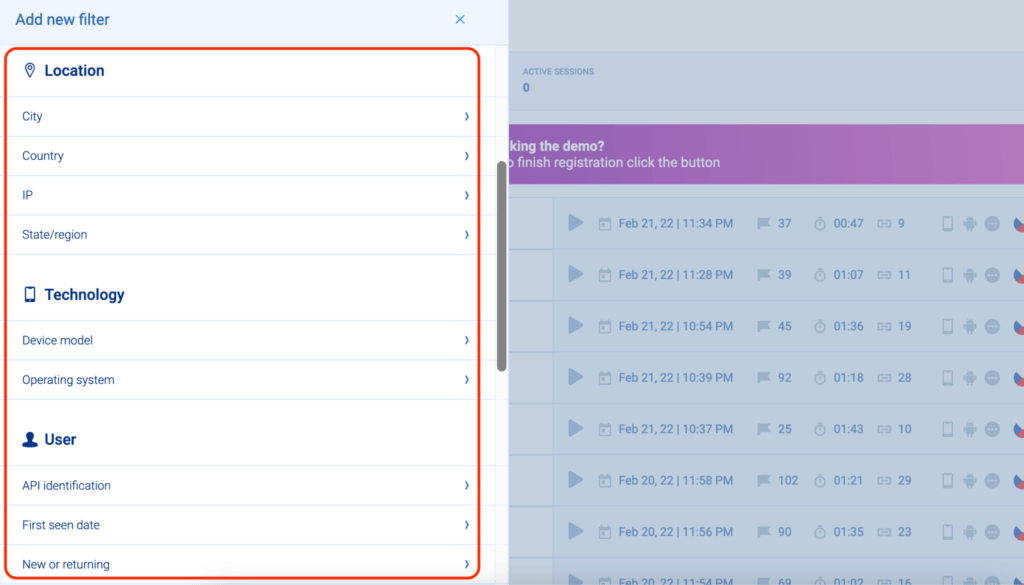
As our customer Cyn Armistead, Technical Support Engineer at Travel Syndication Technology, says: “If a session exists, I know I can find it — fast.”
Smartlook also detects JavaScript errors and rage clicks by default, allowing you to instantly find session replays of users who were frustrated or experienced an error.
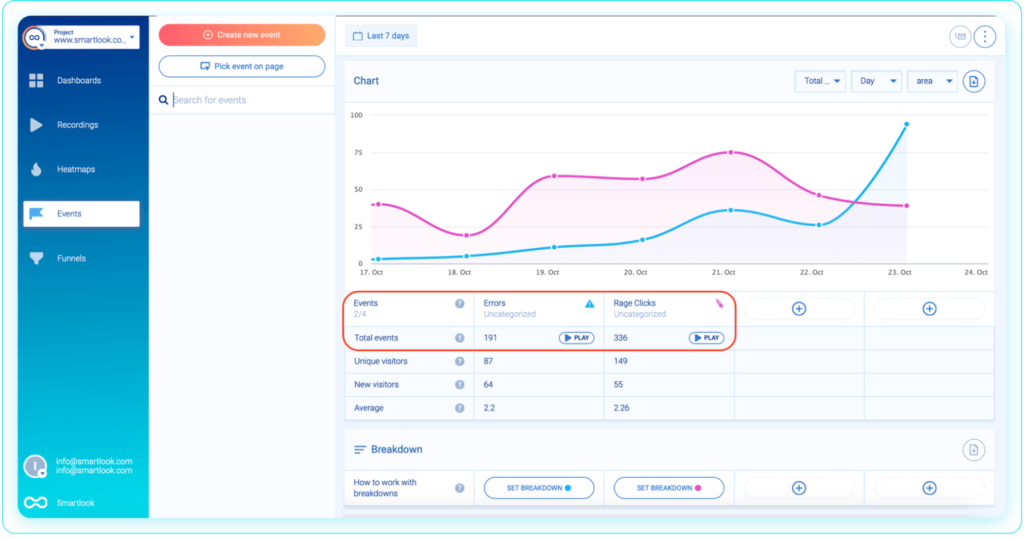
In fact, one of our clients (the biggest search engine for discounts and special offers in Central Europe) used session recordings to find 15 bugs on their website in three hours.
Lastly, Smartlook has an Identify API, which you can set up if your website collects user identification details like username or email. When the API is set up, you can use the identifier (e.g., a user’s email) to quickly find all session recordings of a specific user.
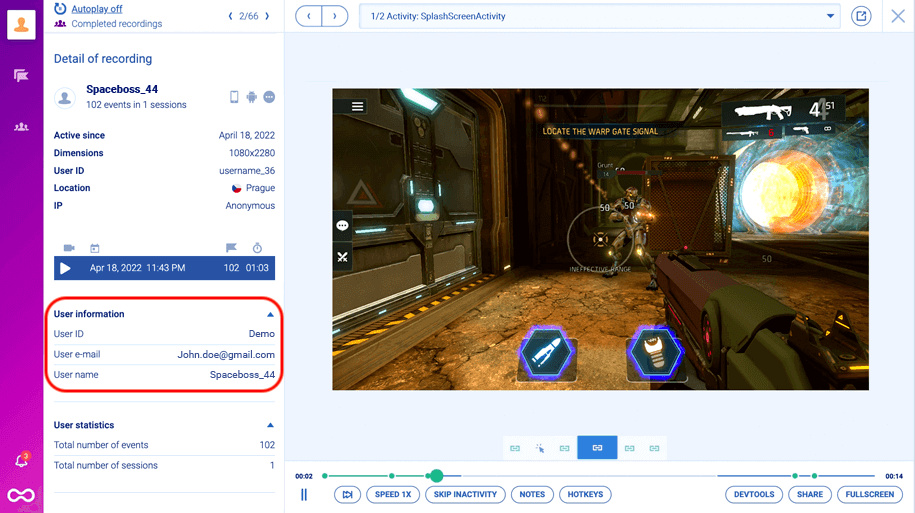
This functionality can help you:
- Analyze the behavior of individual users (e.g., high-paying customers)
- Quickly resolve bugs reported by identified users. For example, when an identified user reports a bug, you can find their session recordings instantly and understand the problem, without having to rely on their explanations (which are often incomplete or inaccurate)
Event tracking: Monitor business-critical user actions (retroactively, without coding)
Monitoring specific interactions like button clicks, text inputs, and URL visits is vital for understanding your users’ behavior. In web analytics, these interactions are called events.
Other tools on this list (like Google Analytics and Hotjar) can also track events. However, they require programming skills and — typically — the use of an extra tool like Google Tag Manager. This makes monitoring user interactions really tedious, as we’ve explained in our article on tracking events with Google Analytics.
In contrast, Smartlook automatically records all user interactions on your site and lets you track events without coding.
Thanks to our always-on session recordings, Smartlook constantly collects user interaction data in the background. All you need to do is select which interactions appear in your dashboard as events (a process called “defining an event”).
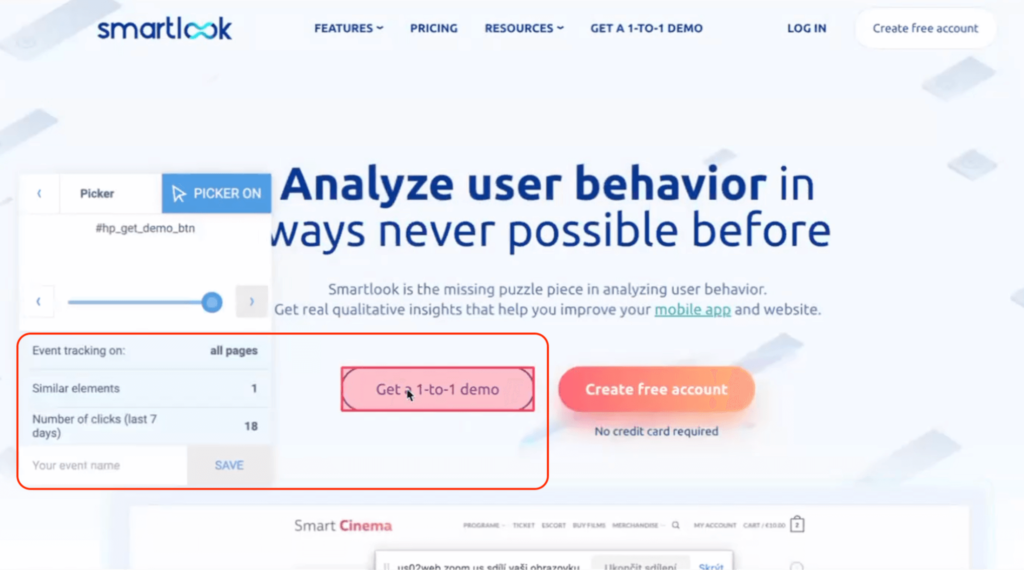
Smartlook offers various ways to define events without coding. For example, you can define events by clicking on elements in your site or app’s UI (as shown in the screenshot below), choosing from a list of template events, and more.
You can also create custom events with JavaScript to track pretty much everything else outside of the standard events.
When you define an event, Smartlook immediately identifies every instance of that event, going back as far as your data retention plan goes. This means you can start analyzing the event instantly, without waiting for data collection.
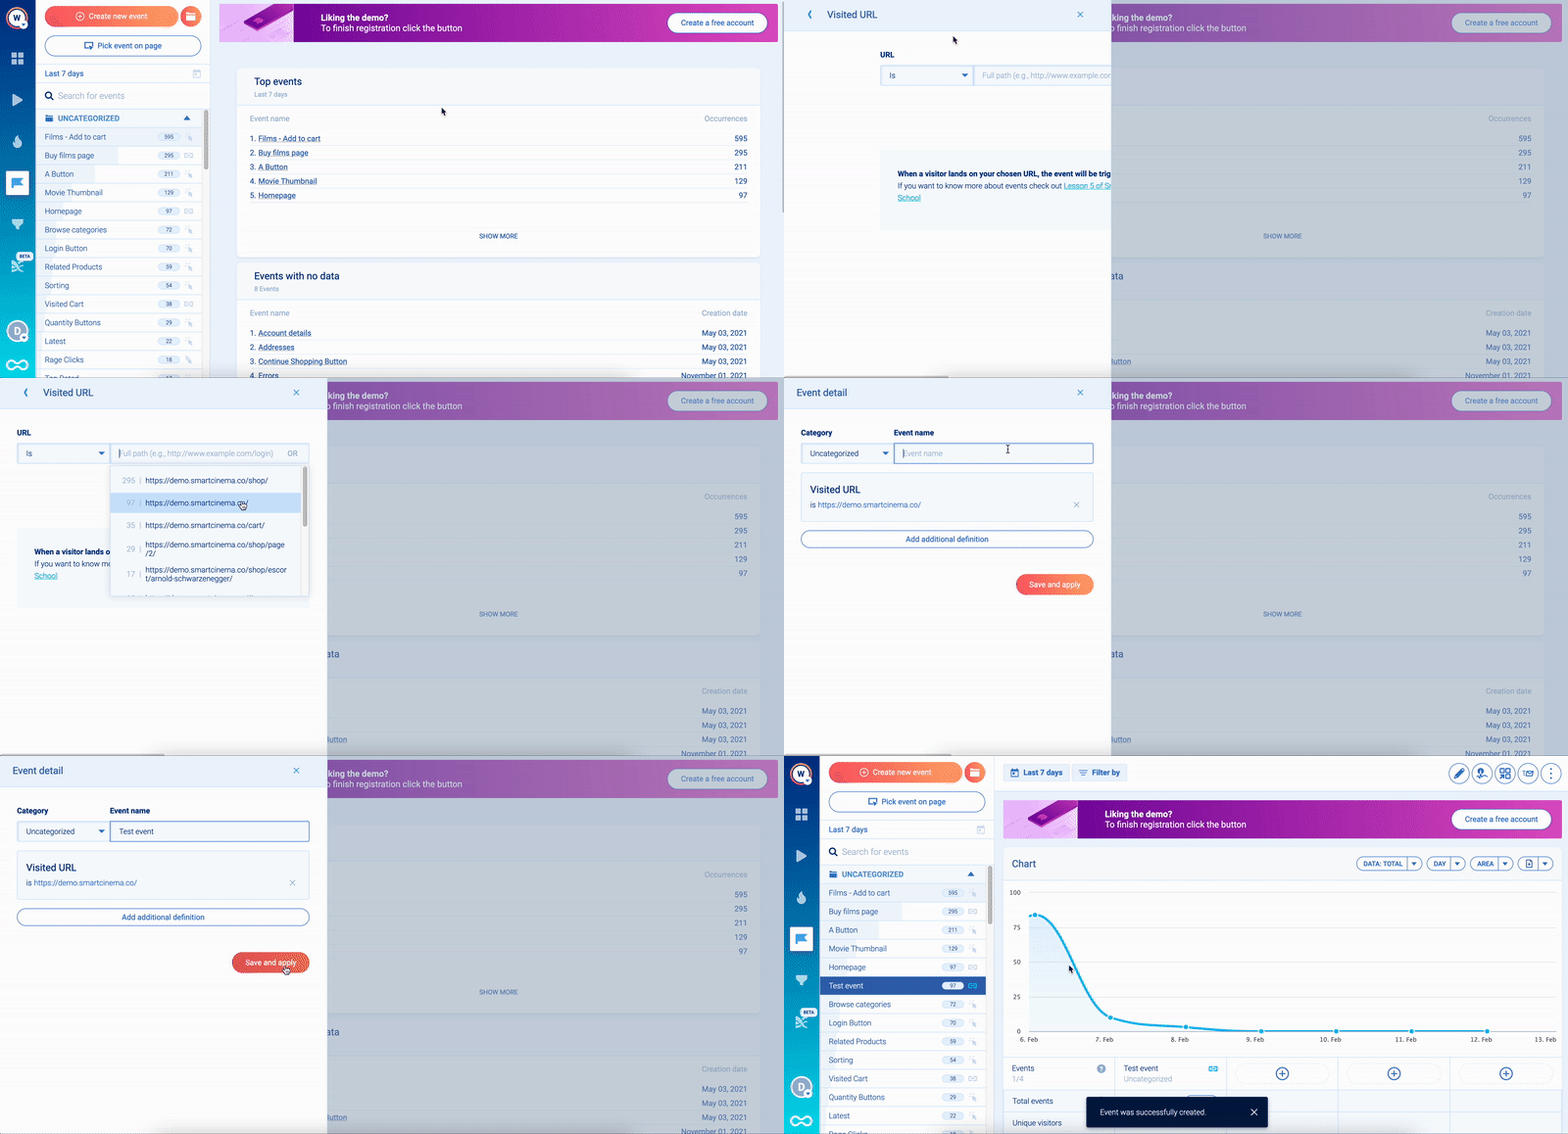
The ability to define events without coding is beneficial in tons of situations. For example, marketing teams can easily set up events to track clicks on CTA buttons, without coding. Then, they can analyze how changes to the CTA copy or button placement affect clicks.
You can also filter session recordings by the events that took place in them.
For example, you can watch recordings of users who added an item to their cart, reached the “Thank you” page on your site, or clicked on “Buy now”.
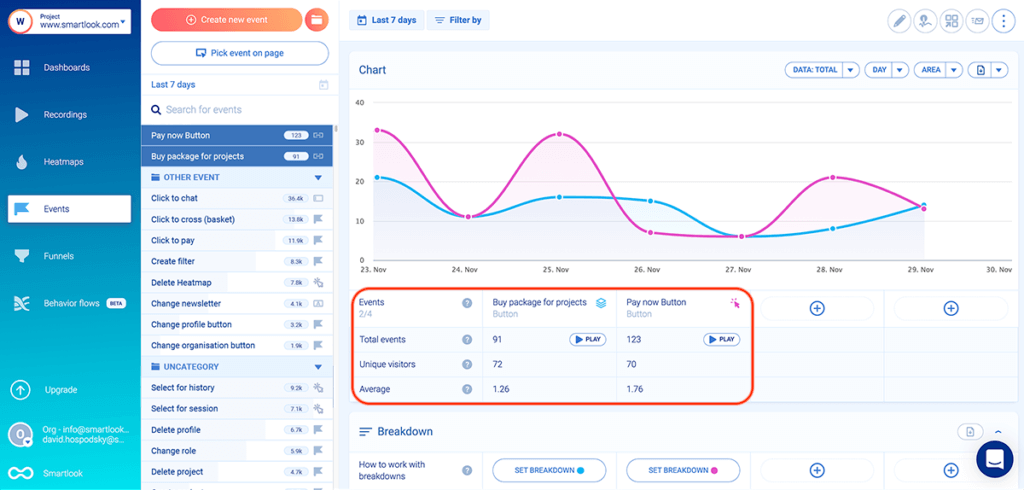
As a result:
- You find relevant session replays much faster
- You see the full context behind an event, i.e., what users did before and after triggering it
You can see how event tracking works in detail with Smartlook’s live public demo (no registration or credit card required).
Funnels: Analyze key user flows, calculate conversion rates, and find drop-off points
Funnels are sequences of steps (i.e., events) users go through to complete a goal on your site, like:
- Adding an item to their cart
- Buying a product
- Signing up for a newsletter
Building funnels lets you analyze how users navigate these flows, find out where they drop off, and calculate conversion rates.
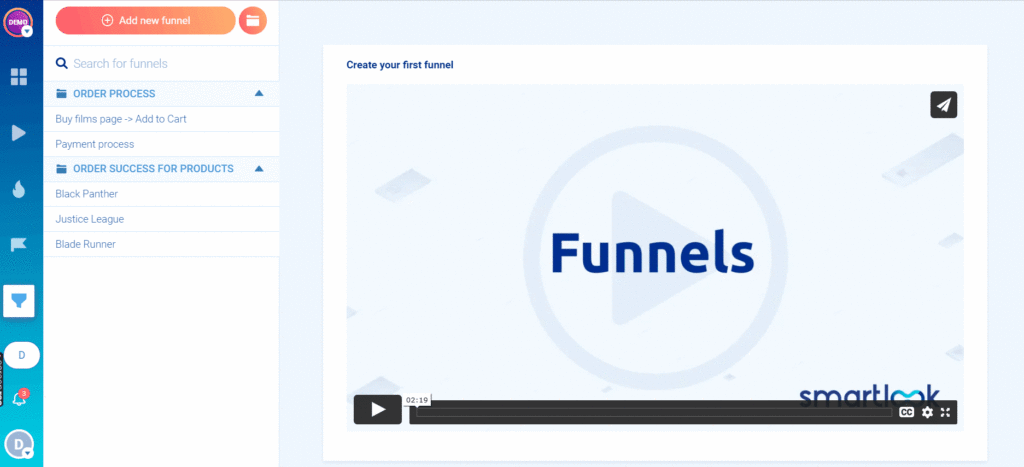
With Smartlook, you can create a funnel by simply placing two or more events in the order you believe your users follow. Then, the funnel visualization appears instantly, as shown in the GIF below.
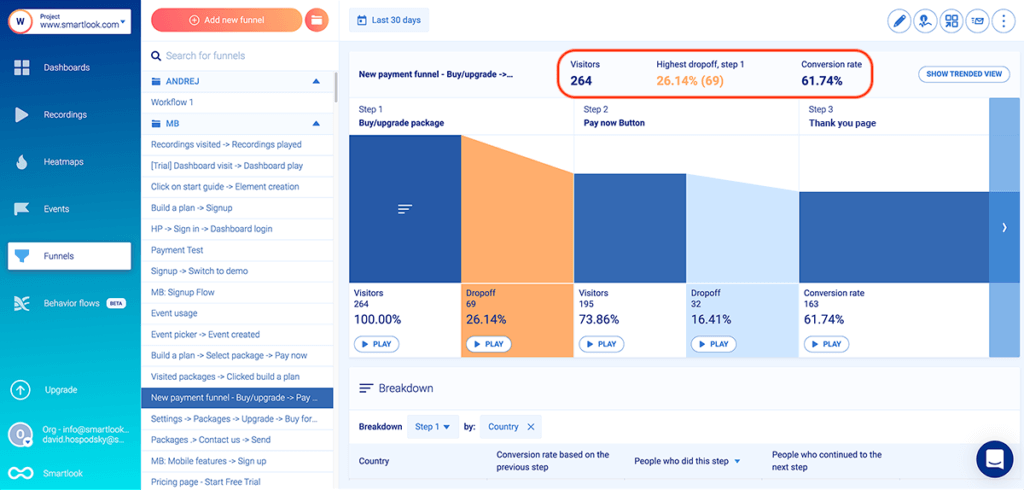
Our platform automatically shows you the funnel’s overall conversion rate, as well as the conversion rates, and drop-offs between each step.
You can break down each step of the funnel (or the entire funnel) by criteria like device, browser, operating system, country, city, and more to see how different user segments interact with your site.
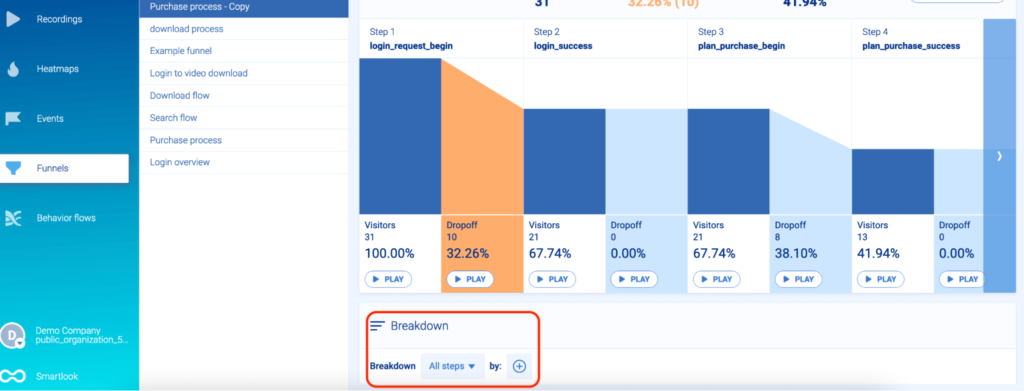
Just like with event tracking, you can also combine funnel analysis with session recordings to find out why users don’t convert.
For example, here’s a three-step checkout funnel built with Smartlook:
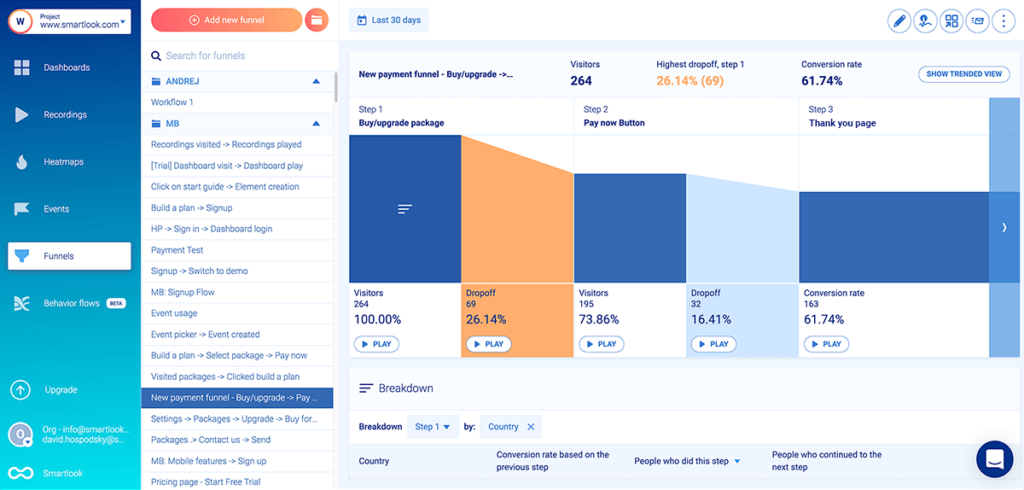
The big problem with this funnel is the drop-off between Steps 2 and 3.
There shouldn’t be a drop-off after Step 2, because visitors who clicked on “Pay now” (Step 2) clearly want to buy and should land on the “Thank you” page (Step 3). Yet, there are 32 users who dropped off at this stage.
Smartlook lets you jump straight into the session recordings of users who dropped off at a specific stage by clicking on the “Play” button underneath it.
In our example, you can watch the session replays of those 32 users who dropped off, which means:
- You can see exactly what happened before they dropped off (especially helpful if a technical error prevented them from checking out).
- You don’t have to sift through all 264 session recordings of visitors who entered this funnel.
Similar to the event tracking process, you can build funnels with other analytics tools on this list (e.g., Google Analytics or Kissmetrics). However, due to their lack of session recordings, these tools can only show you where users drop-off, not why. As a result, figuring out why they don’t convert can take weeks or months of hypothesizing and A/B testing.
Smartlook pricing
- Free Plan: Records up to 3,000 user sessions per month (no credit card required).
- Paid Plans: Start at $55/month, with a 30-day free trial. There is pre-made plan as well as an option for building custom plans.
Start analyzing and improving the experience of your website’s visitors with Smartlook’s full-featured, 30-day trial — no credit card required. If you need more time to evaluate, use our forever-free plan as long as you need.
For a detailed Smartlook presentation that’s tailored to your business, schedule a demo with our team.
2. Crazy Egg
Crazy Egg is a conversion rate optimization (CRO) and behavior analytics tool. It offers heatmaps, user (session) recordings, A/B testing, and features for tracking ad traffic on your website.
Unlike Smartlook, Crazy Egg doesn’t capture every user session on your website. Instead, it samples your traffic, and you have to manually choose the rate at which the sampling happens.
Crazy Eggpricing
- Free Plan: No free plan, only a free 30-day trial.
- Paid Plans: Start at $29/month, with a 30-day free trial. All plans are billed annually.
3. Hotjar
Hotjar is a popular heatmap and session recordings tool that also offers user feedback and on-site survey features. It’s a beginner-friendly tool for marketers, product managers, and UX professionals.
One downside to this tool, which we’ve discussed in our Hotjar alternatives article, is the fact that it no longer has funnel analysis features.
Hotjar pricing
- Free Plan: Records up to 35 user sessions/day.
- Paid Plans: Start at $39/month for their heatmap and session recording features. Their survey and user feedback features are billed separately, starting at $59/month.
3 traditional website analytics tools
Traditional website analytics tools provide an aggregate view of your site’s traffic, with a focus on stats and metrics like sessions, bounce rate, time on page, and more.
While they lack qualitative analytics features (like session recordings and pop-up surveys), they have many useful reports and dashboards for analyzing website traffic, uncovering how visitors come to your site, visualizing key performance indicators (KPIs), and more.
Similar to behavior analytics tools, most traditional analytics tools are set up by installing a code snippet. However, more advanced tools (like Kissmetrics) have a complicated setup that requires an understanding of their data model and usually — programming skills.
Lastly, website analytics tools are typically used by marketing and product teams to analyze campaigns and get anonymized audience insights.
4. Google Analytics
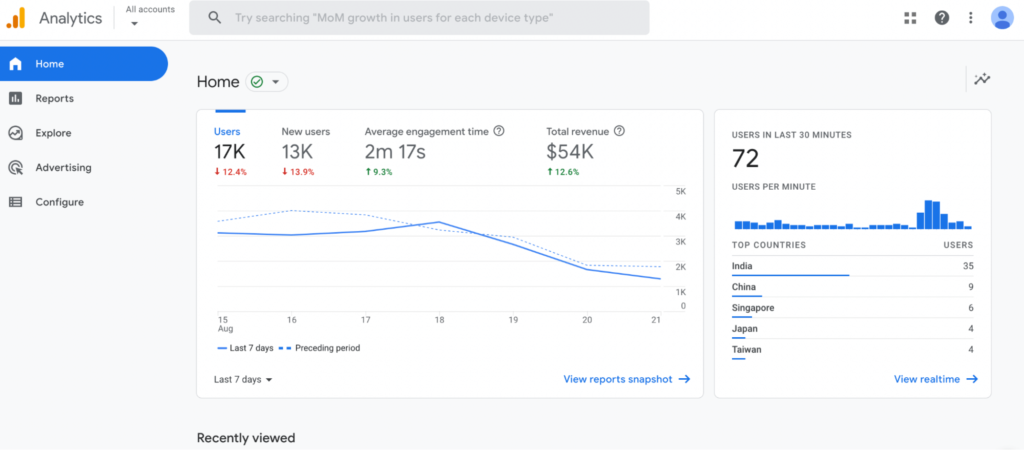
Google Analytics is by far the most popular tool for analyzing website traffic. As a traditional analytics solution, it reports on stats and metrics about a site’s traffic like page visits, sessions, time on page, bounce rates, and much more.
Being a traditional analytics solution, Google Analytics can show you how users interact with your site. However, the lack of session recordings and the manual event tracking setup often prevent teams from finding out why users don’t convert, as we discussed in our article on the top 13 Google Analytics alternatives.
You can overcome some of these limitations by integrating Google Analytics with Smartlook.
Google Analyticspricing
- Free Plan:Google Analytics is a free product.
- Paid Plans: There’s an enterprise version (Analytics 360), with pricing available upon request to their sales team.
5. Clicky
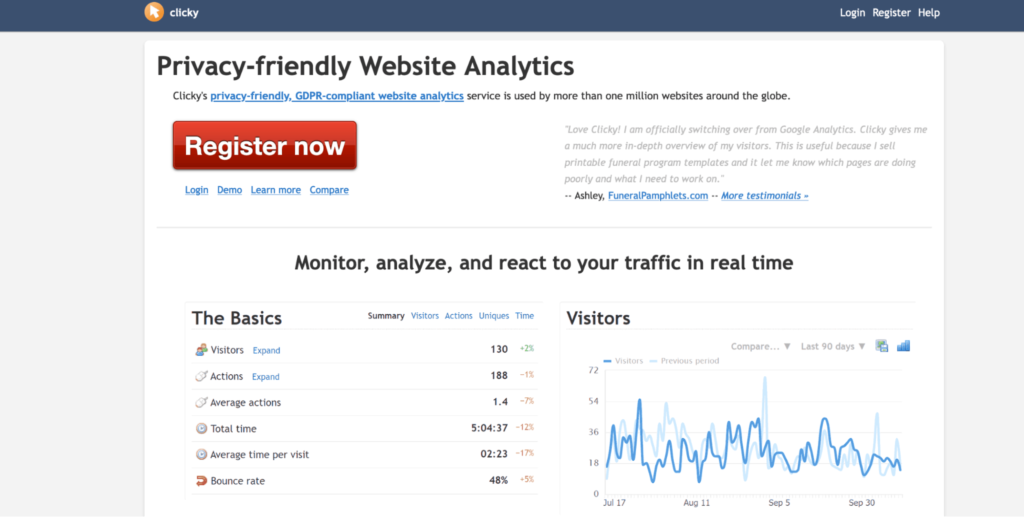
Clicky is a privacy-friendly web analytics tool, which provides insights about your website’s traffic in real-time. Similar to Google Analytics, Clicky focuses on quantitative analytics, while also offering additional features like uptime monitoring and heatmaps.
Clicky Pricing
- Free Plan: Available for websites with up to 3,000 daily pageviews.
- Paid Plans: Start at $9.99/month, depending on the number of websites you want to analyze and their daily pageviews.
6. Kissmetrics
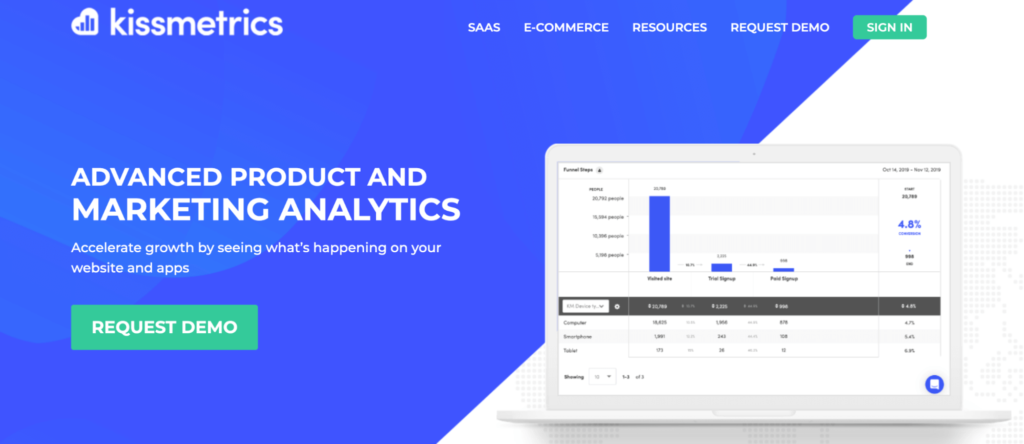
Kissmetrics is a more advanced analytics tool, with specialized features for SaaS and e-commerce businesses. It reports on stats and metrics like new subscriptions, revenue, churn rate per customer segments, time to sign up, and more.
Kissmetricspricing
- Free Plan:Kissmetrics doesn’t have a free plan, only a demo.
- Paid Plans: Start at $299/month for up to 10,000 monthly tracked users.
3 tools for website visitor identification
Visitor identification tools help website owners identify which companies are visiting their site.
These tools use various techniques (like analyzing IP addresses with reverse DNS lookups) to find out details about the prospects visiting your site. This information is useful for B2B companies that want to target specific businesses with their sales and marketing efforts.
In addition to visitor identification, most of these tools can help you analyze how leads engage with your content, as well as segment leads based on individual, behavioral, and demographic data. These capabilities can be beneficial for B2B sales reps, marketing teams, and customer success professionals.
Lastly, the visitor identification tools below integrate with popular customer relationship management systems (CRMs) like Salesforce, HubSpot, and Zoho, as well as other marketing and sales automation solutions.
7. Leadfeeder
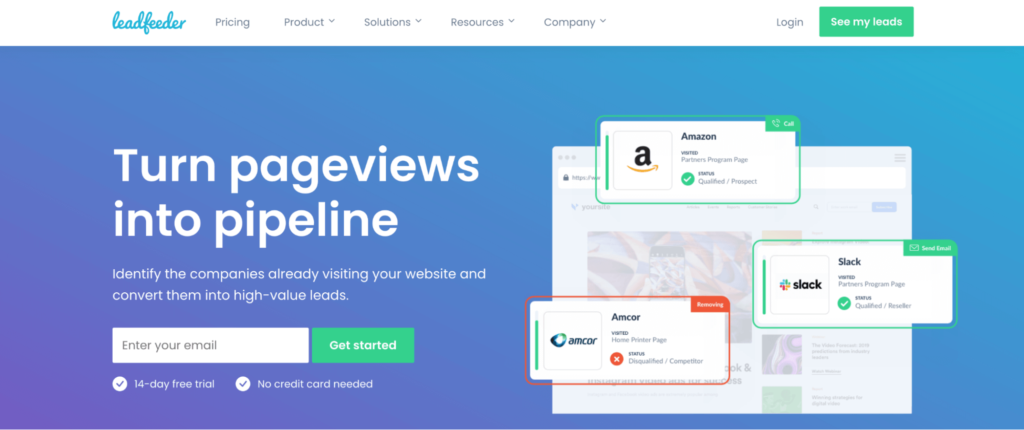
Leadfeeder is a tool that helps B2B businesses identify the companies visiting their site and generate high-quality sales leads. Their custom segmentation lets you create behavioral and demographic filters to segment the leads with the highest potential of converting. Plus, their Contacts feature helps salespeople determine the best person to contact from a company that’s visited your site.
Leadfeeder pricing
- Free Plan: Leadfeeder has a free version (called Lite), which comes with limited features and seven days of data retention.
- Paid Plans: Start at $79/month with premium features, unlimited data retention, and a 14-day free trial.
8. Lead Forensics
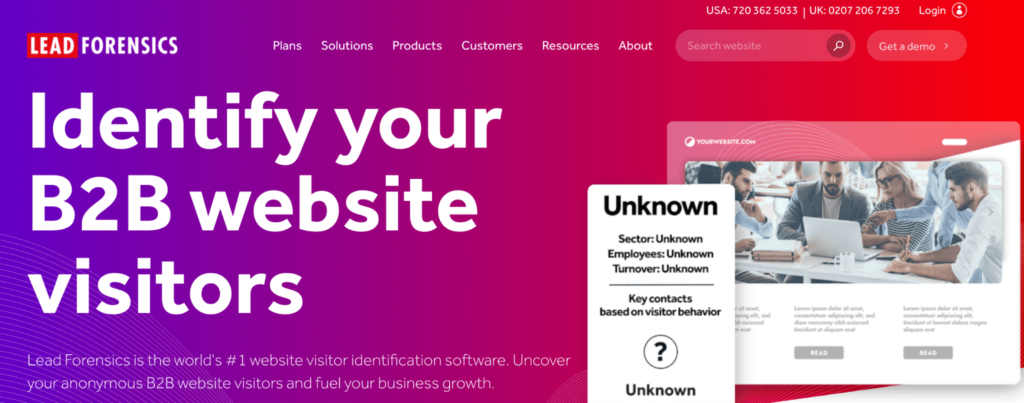
Lead Forensics is a real-time website visitor identification software. Besides providing details about the leads visiting your site (like company names, phone numbers, and social media), Lead Forensics shows customer engagement insights into what content they’re looking at. Plus, it can send you real-time notifications when a company in your pipeline visits your website, so you can quickly follow up with them.
Lead Forensics pricing
- Free Plan: No free plan, only a free trial.
- Paid Plans: Pricing is available after a request to their sales team or after completing the free trial.
9. Salespanel
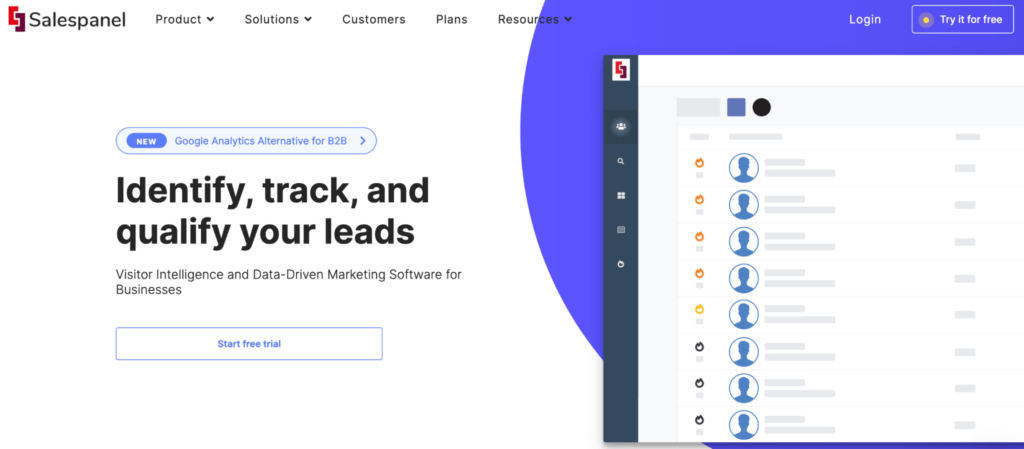
Salespanel is a visitor intelligence and data-driven marketing software that can help you identify, track, and qualify leads. Their product covers many use cases, including lead tracking (tracking website visitors in real-time), lead generation (identifying quality leads that visit your site), lead scoring (creating scoring frameworks based on different attributes), and more.
Salespanel pricing
- Free Plan: No free plan, only a free trial.
- Paid Plans: Start at $149/month for tracking up to 5,000 monthly visitors.
Get Smartlook and track everything your visitors do on your site automatically
Sign up for a full-featured, 30-day trial of Smartlook (no credit card required) and start analyzing your visitors’ behavior with the help of session recordings, events, funnels, and heatmaps.
Our platform can be used on all kinds of websites, including those built with popular CMSs like WordPress, Joomla, and Shopify. Additionally, Smartlook has integrations with widely-used A/B testing software like Google Optimize and Optimizely, as well as other analytics solutions like Google Analytics and Mixpanel.
For an in-depth Smartlook presentation that’s tailored to your business, schedule a demo with our team.


